


2010 Air Quality Progress Report for
Isle of Wight Council
In fulfillment of Part IV of the Environment Act 1995
Local Air Quality Management
April 2010
| Local Authority Officer | William G Berry |
| Department | Environmental Health |
| Address | Jubilee Stores The Quay Newport Isle of Wight PO30 2EH |
| Telephone | 01983 823000 |
| e-mail |
| Report Reference number | |
| Date | 26 April 2010 |
Executive Summary
This report summarises the few changes since the Updating and Screening Assessment was published in 2009.
Continuing diffusion tube monitoring again demonstrates that concentrations of Nitrogen Dioxide are below the statutory limit, and that therefore there is no requirement to proceed to a Detailed assessment.
Continuing diffusion tube monitoring again demonstrates that concentrations of Nitrogen Dioxide are below the statutory limit, and that therefore there is no requirement to proceed to a Detailed assessment.
Table of contents
Appendices
Appendix A QA:QC Data 25
List of Tables
Table 1.1 AQ Objectives 7
Table 2.2 Details of non-automatic monitoring sites 12
Table 2.4 Results of NO2 diffusion tubes 14
QA/QC of diffusion tube monitoring 25
List of Figures
Figure 2.2 Maps of monitoring site 10
1 Introduction
1.1 Description of Local Authority Area
The Isle of Wight is an island off the south coast of England. There are urban areas at Newport, Ryde, and the south-east coastal strip between Sandown and Shanklin. However, the majority of the Island is rural in character.
Tourism is a major contributor to the Island economy. It is estimated that the population is approximately double during the holiday season, with a large influx of visitors. It would be expected that this would result in significant differences between air pollution levels between winter and summer. Diffusion tube monitoring has not borne this out.
Tourism is a major contributor to the Island economy. It is estimated that the population is approximately double during the holiday season, with a large influx of visitors. It would be expected that this would result in significant differences between air pollution levels between winter and summer. Diffusion tube monitoring has not borne this out.
1.2 Purpose of Progress Report
Progress Reports are required in the intervening years between the three-yearly Updating and Screening Assessment reports. Their purpose is to maintain continuity in the Local Air Quality Management process.
They are not intended to be as detailed as Updating and Screening Assessment Reports, or to require as much effort. However, if the Progress Report identifies the risk of exceedence of an Air Quality Objective, the Local Authority (LA) should undertake a Detailed Assessment immediately, and not wait until the next round of Review and Assessment.
They are not intended to be as detailed as Updating and Screening Assessment Reports, or to require as much effort. However, if the Progress Report identifies the risk of exceedence of an Air Quality Objective, the Local Authority (LA) should undertake a Detailed Assessment immediately, and not wait until the next round of Review and Assessment.
1.3 Air Quality Objectives
The air quality objectives applicable to Local Air Quality Management (LAQM) in England are set out in the Air Quality (England) Regulations 2000 (SI 928), and the Air Quality (England) (Amendment) Regulations 2002 (SI 3043). They are shown in Table 1.1. This table shows the objectives in units of microgrammes per cubic metre μg/m3 (for carbon monoxide the units used are milligrammes per cubic metre, mg/m3). Table 1.1. includes the number of permitted exceedences in any given year (where applicable).
Table 1.1 Air Quality Objectives included in Regulations for the purpose of Local Air Quality Management in England.
| Pollutant | | Date to be achieved by | |
| Concentration | Measured as | ||
| Benzene | 16.25 µg/m3 | Running annual mean | 31.12.2003 |
| 5.00 µg/m3 | Running annual mean | 31.12.2010 | |
| 1,3-Butadiene | 2.25 µg/m3 | Running annual mean | 31.12.2003 |
| Carbon monoxide | 10.0 mg/m3 | Running 8-hour mean | 31.12.2003 |
| Lead | 0.5 µg/m3 | Annual mean | 31.12.2004 |
| 0.25 µg/m3 | Annual mean | 31.12.2008 | |
| Nitrogen dioxide | 200 µg/m3 not to be exceeded more than 18 times a year | 1-hour mean | 31.12.2005 |
| 40 µg/m3 | Annual mean | 31.12.2005 | |
| Particles (PM10) (gravimetric) | 50 µg/m3, not to be exceeded more than 35 times a year | 24-hour mean | 31.12.2004 |
| 40 µg/m3 | Annual mean | 31.12.2004 | |
| Sulphur dioxide | 350 µg/m3, not to be exceeded more than 24 times a year | 1-hour mean | 31.12.2004 |
| 125 µg/m3, not to be exceeded more than 3 times a year | 24-hour mean | 31.12.2004 | |
| 266 µg/m3, not to be exceeded more than 35 times a year | 15-minute mean | 31.12.2005 | |
1.4 Summary of Previous Review and Assessments
First Round Air Quality Review
The first round of the review in 2000 gave results that indicated that it was not necessary to proceed to a Detailed Assessment, as the specified pollutants were predicted to be below the Air Quality Objectives.
The report of the 2000 review is not available on-line.
Second Round Updating and Screening Assessment 2004
During the second round, the Updating and Screening report 2004 identified that there was a possibility that, for two of the pollutants, concentrations may exceed the Objectives in specific areas.
A Detailed Assessment was carried out in 2004, examining two pollutants. Since the first round of assessment, a new housing estate had been built close to the petrol storage depot at Kingston, East Cowes. Computer modelling was therefore carried out, to predict benzene concentrations in the area. This was supplemented by diffusion tube monitoring for a short period. The results of the monitoring were reported in an Air Quality Progress Report in 2005. The modelling, together with the diffusion tube results, showed that the benzene concentration in air close to the site was very unlikely to exceed the Objective. There was therefore no need to declare an Air Quality Management Area for Benzene.
In addition, the modelling for sulphur dioxide emissions from the three cross-Solent ferry terminals also showed that there would be no exceedance of the short-term Objective for SO2.
Third Round Updating and Screening Assessment 2006
During the third round, in 2006, it was identified that, at two of the sites (Fairlee Road and Lake Hill) there is a possibility that the Air Quality Objective for Nitrogen dioxide may be exceeded.
It was therefore decided to increase the number of diffusion tubes placed at the two sites, to monitor nitrogen oxides. Diffusion tubes are not as exact as they could be, so there was some doubt about the actual concentrations measured. Using three tubes at each site gives a more reliable result.
Detailed Assessment for Nitrogen Dioxide
This was carried out using additional monitoring, using diffusion tubes. The 2007 Detailed Assessment Report concluded that there were unlikely to be exceedances of the guideline standard for Nitrogen dioxide at either of the two sites referred to above.
A Progress report was submitted in 2008.
Fourth Round Updating and Screening Assessment 2009
This concluded that the air quality guidelines were unlikely to be exceeded, and that there is therefore no requirement to proceed to a Detailed Review.
Figure 1.1 Map of AQMA Boundaries (if applicable)
There are no Air Quality Management Areas on the Isle of Wight.
2 New Monitoring Data
2.1 Summary of Monitoring Undertaken
2.1.1 Automatic Monitoring Sites
There are no automatic monitoring sites on the Isle of Wight.
2.1.2 Non-Automatic Monitoring
Previous rounds of diffusion tube monitoring at various locations have resulted in the conclusion that the critical area is along Fairlee Road, Newport. This is the main link between the towns of Newport and Ryde. It is also the main route between the cross-Solent vehicle ferries at East Cowes and at Fishbourne, and that half of the Island that lies to the West of Newport.
Figure 2.2 Map(s) of Non-Automatic Monitoring Sites (if applicable)
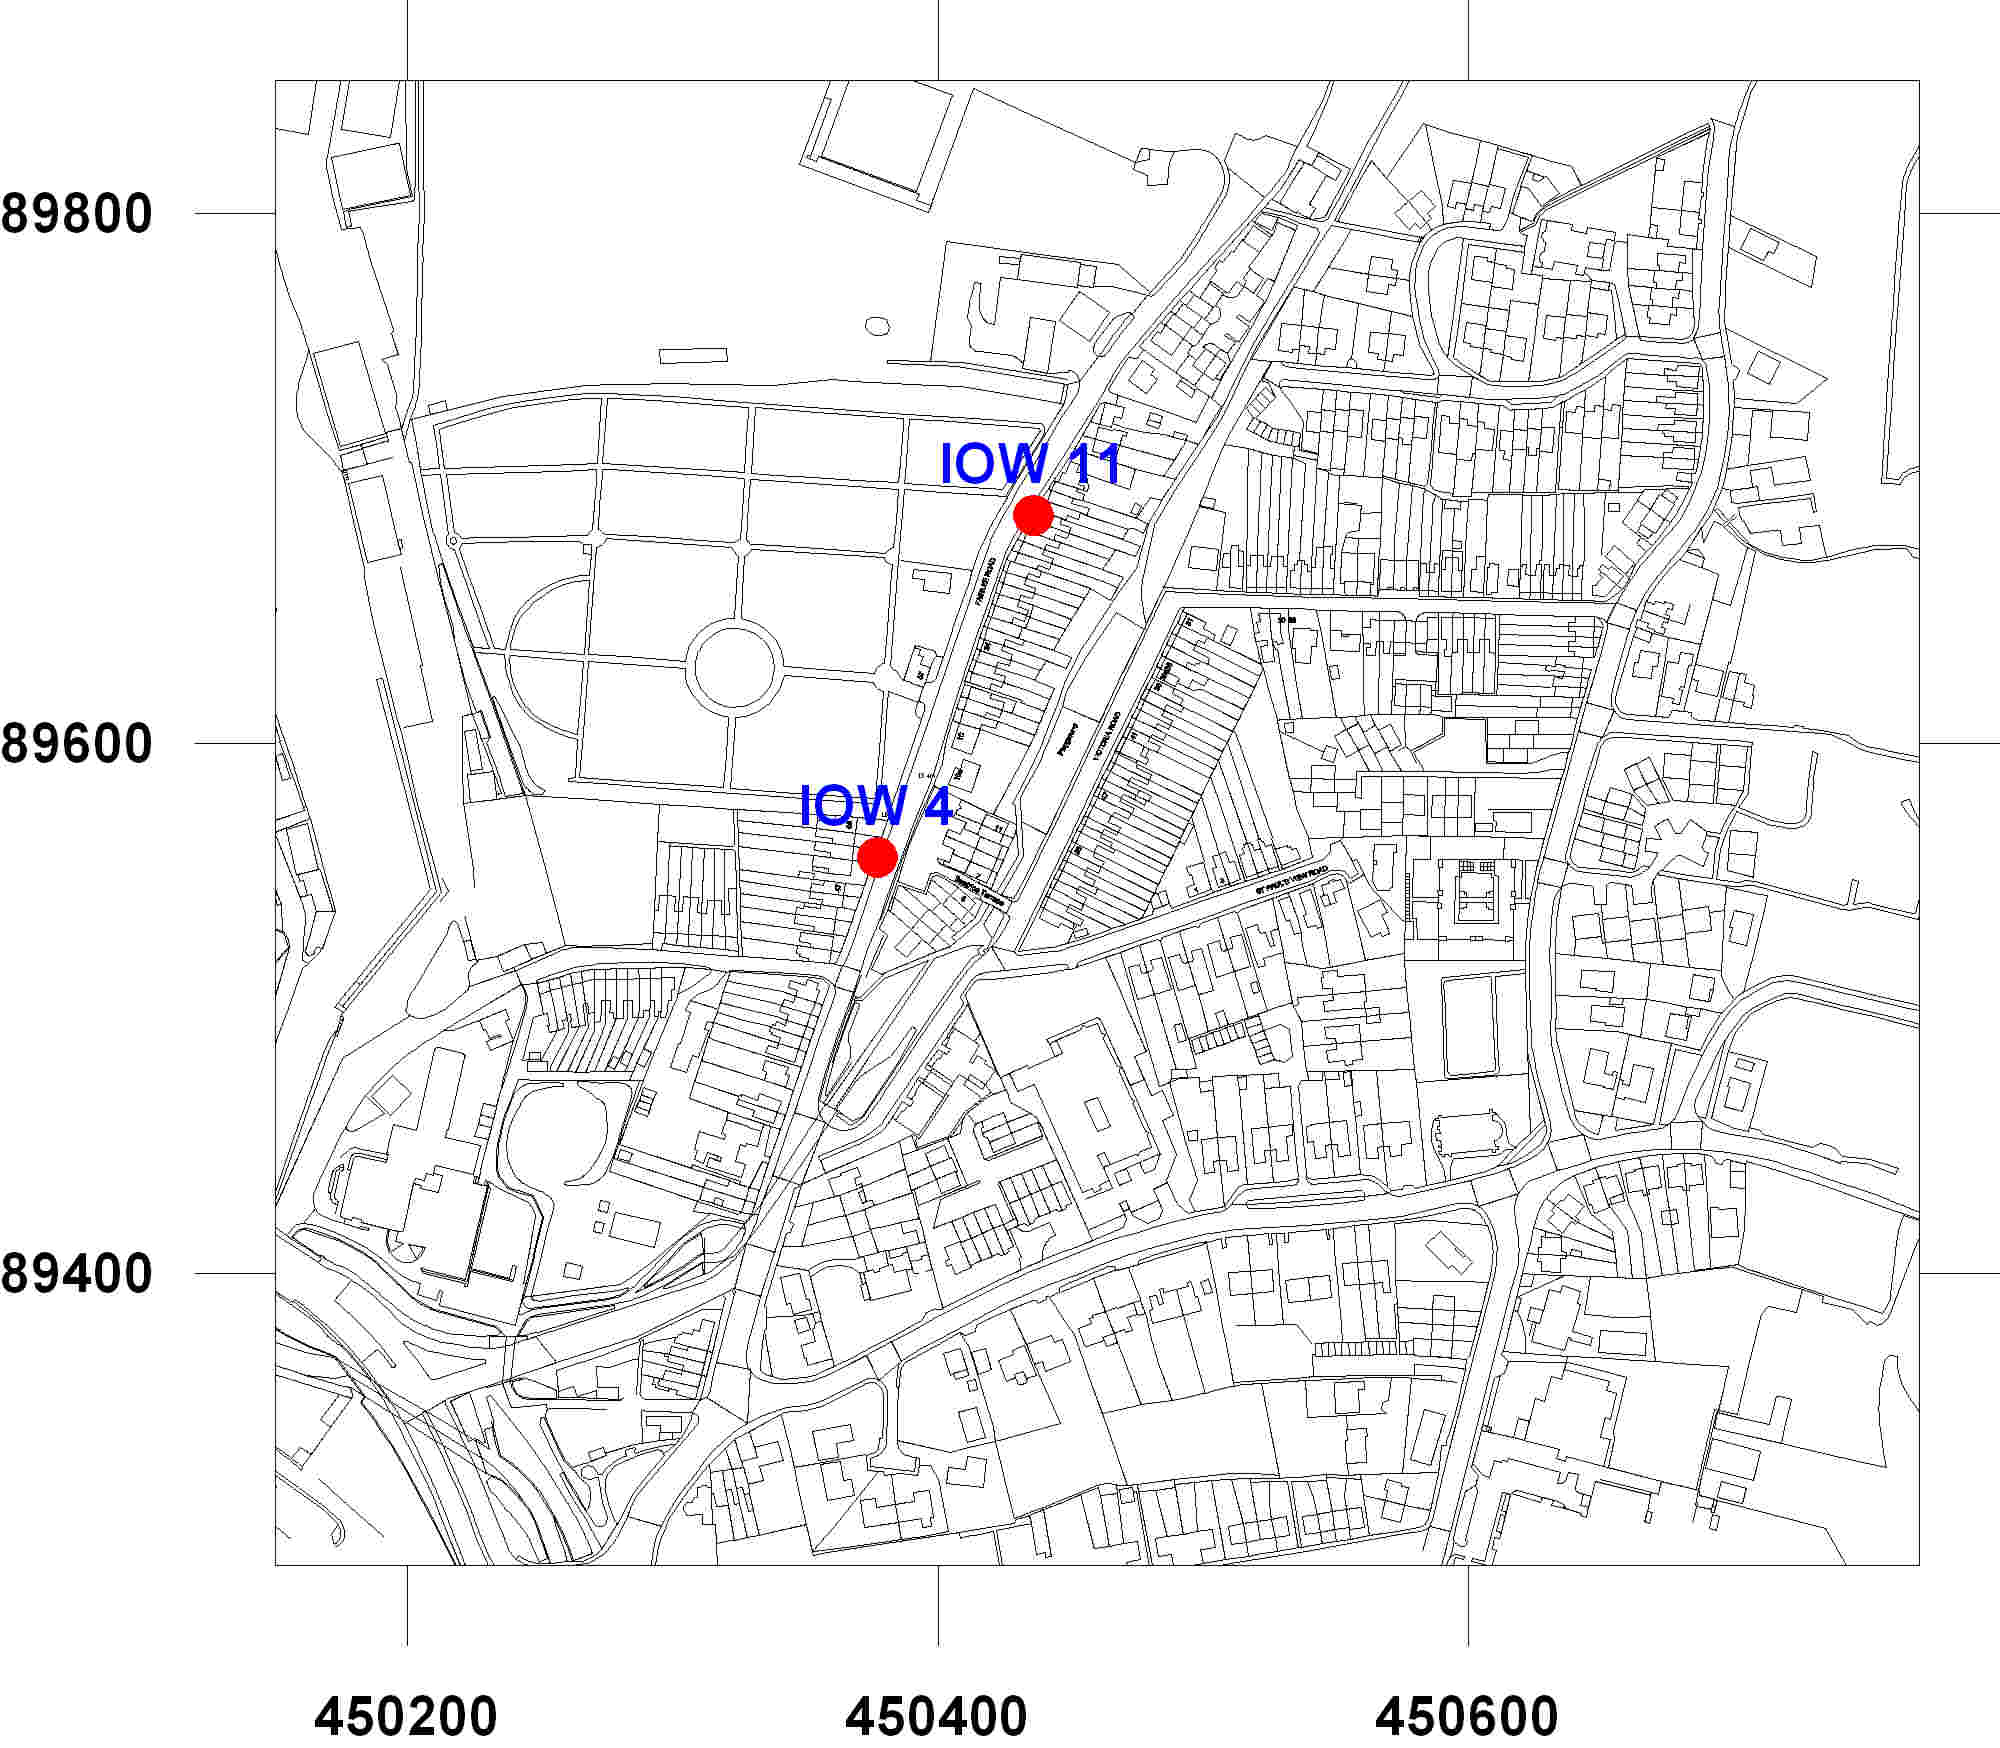
Monitoring locations at Fairlee Road, Newport
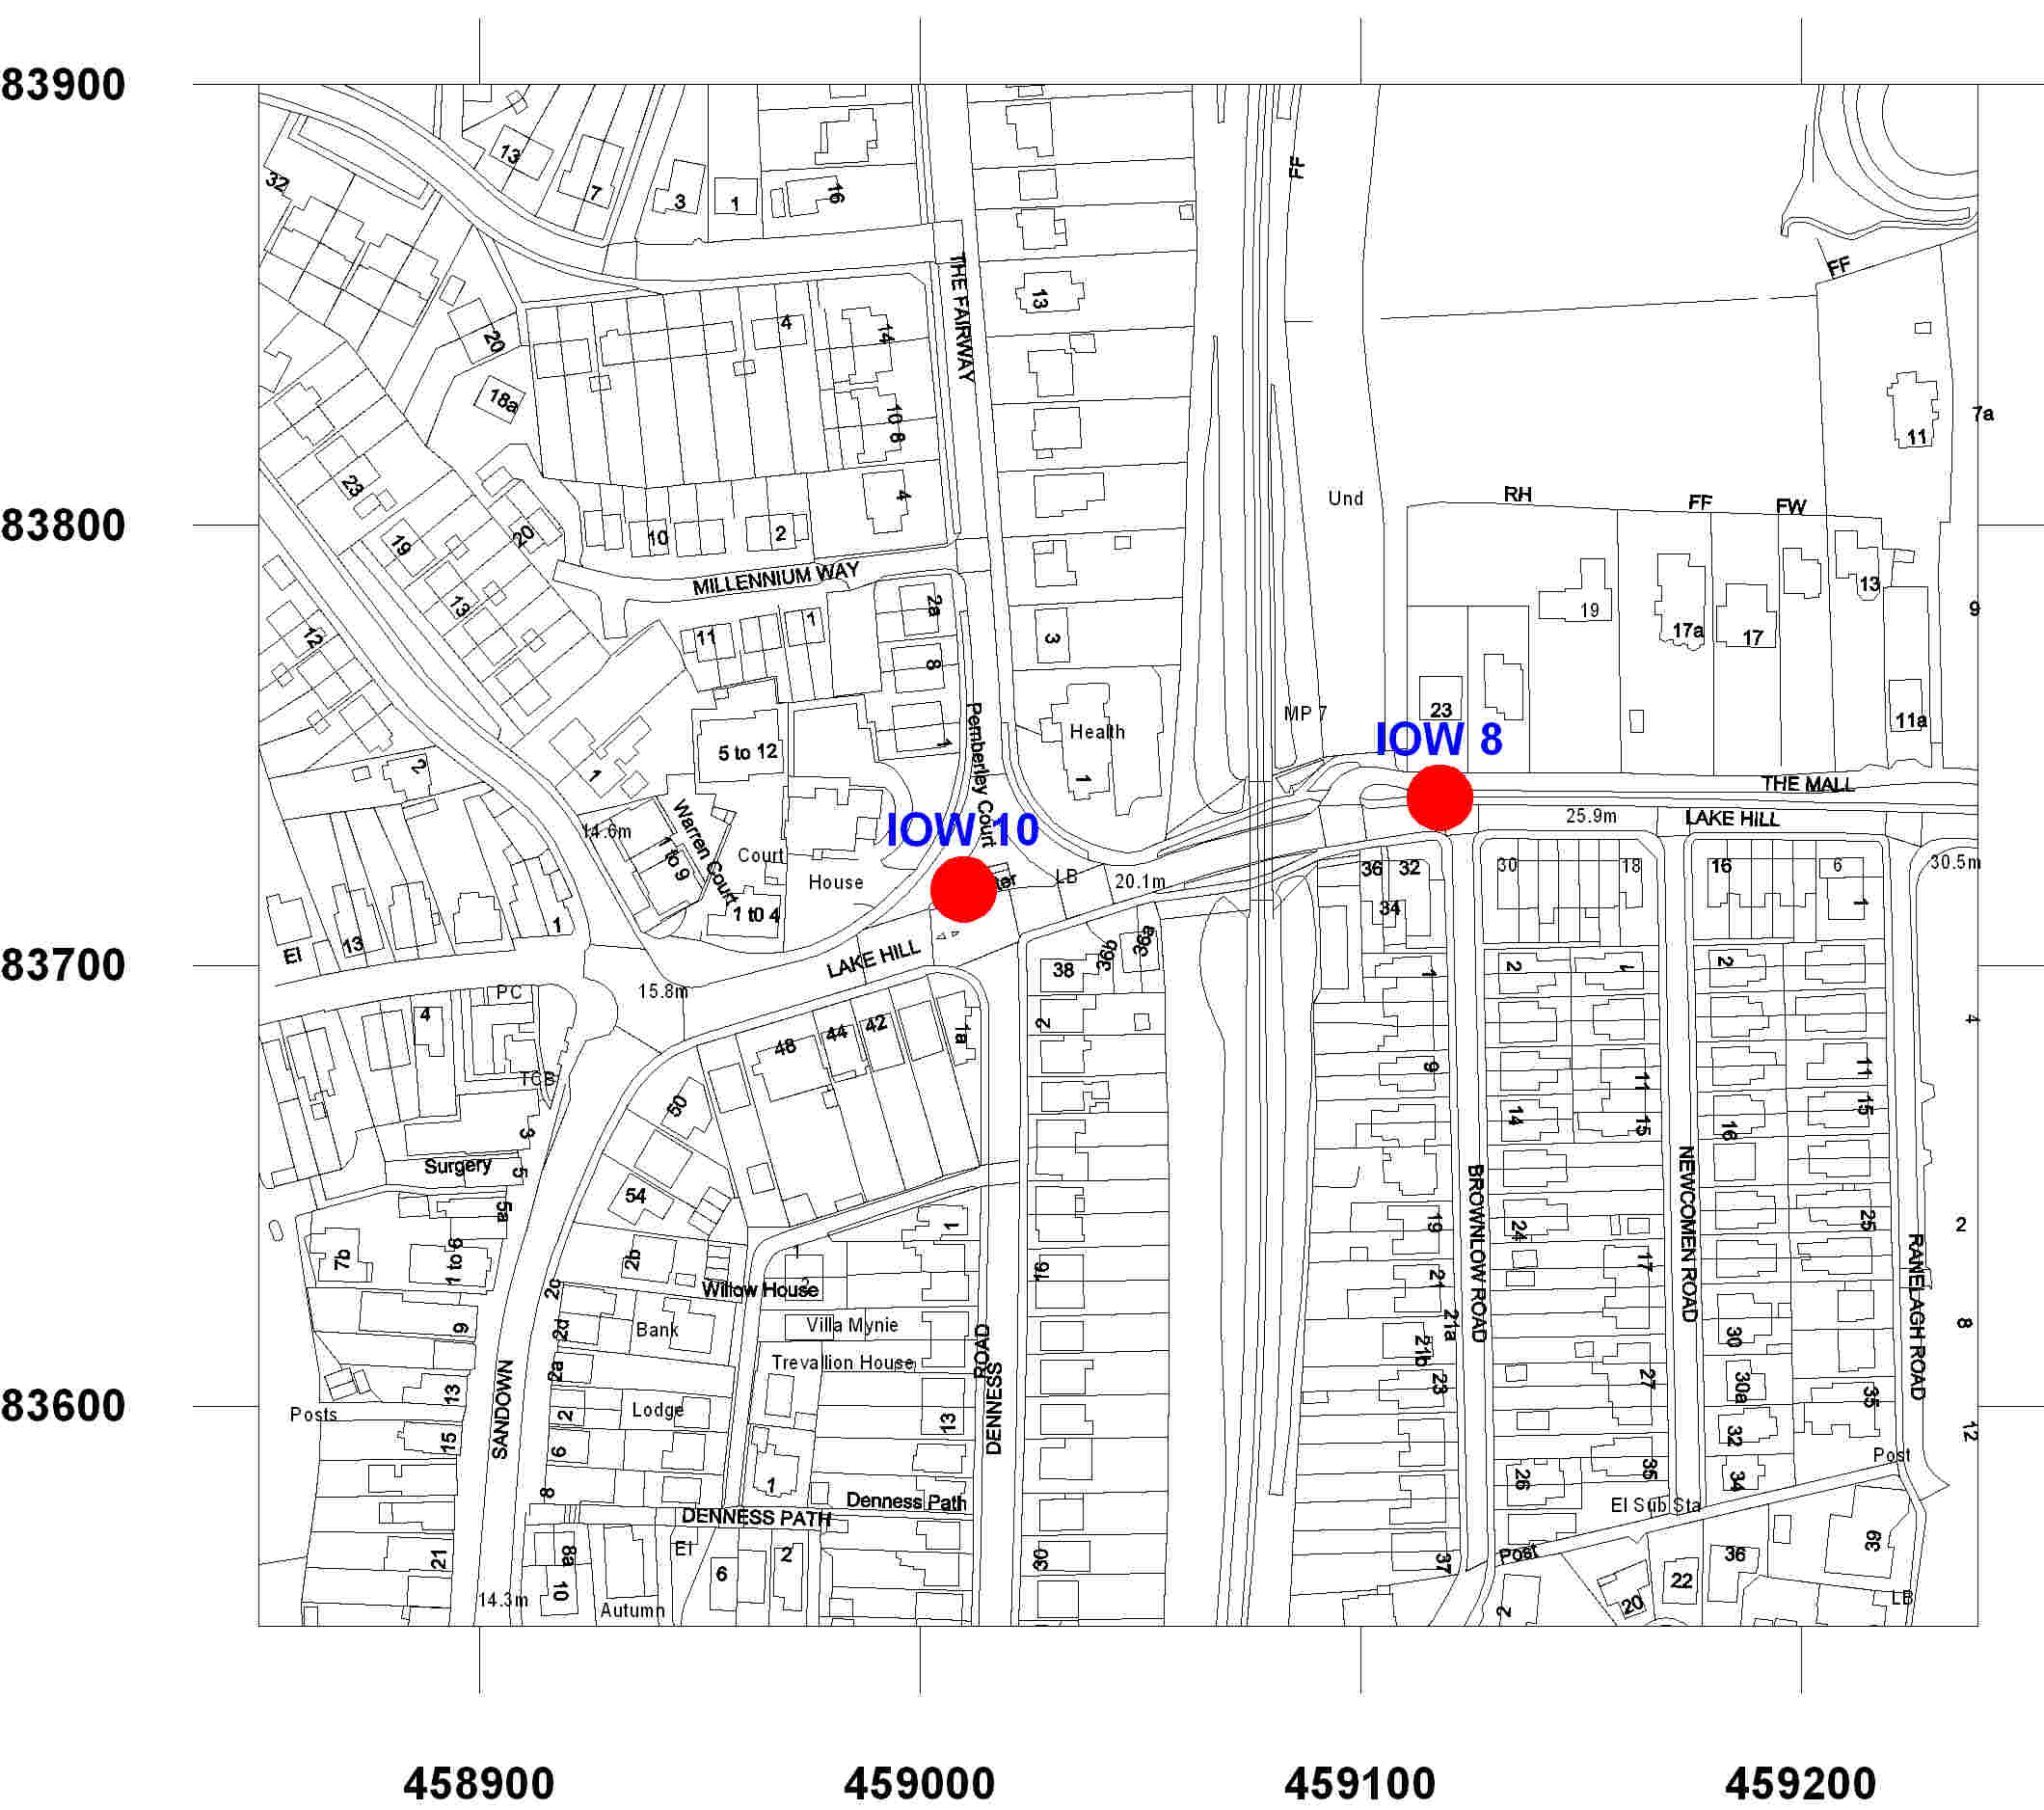
Monitoring locations at Lake Hill, Lake
Figure 2.2 Map(s) of Non-Automatic Monitoring Sites (if applicable)
Monitoring locations at Fairlee Road, Newport
Monitoring locations at Lake Hill, Lake
Table 2.2 Details of Non- Automatic Monitoring Sites
| Site Name | Site Type | OS Grid Ref | Pollutants Monitored | In AQMA? | Relevant Exposure? (Y/N with distance (m) to relevant exposure) | Distance to kerb of nearest road (N/A if not applicable) | Worst-case Location? | |
| Example 1 | Urban backgrd. | X111222 | Y222111 | NO2 | Y | Y (1m) | 3m | Y |
| Fairlee Road, South IW4 | Kerbside | 450377 | 089557 | NO2 | No | N (11 m) | 0 | Y (kerbside) |
| Lake IW10 | Kerbside | 459101 | 083717 | NO2 | No | N (23m) | 2 m | Y (kerbside) |
| Fairlee Road, North IW11 | Roadside | 450436 | 089686 | NO2 | No | Y | 11 m | Y (façade) |
2.2 Comparison of Monitoring Results with Air Quality Objectives
The Nitrogen dioxide diffusion tube monitoring during 2009 demonstrates that the concentrations of this pollutant are below the statutory limits.
2.2.1 Nitrogen Dioxide
During 2009, diffusion tube monitoring was continued.
The bias adjustment factor used was taken from the latest spreadsheet published on the Review and Assessment web site. Isle of Wight Council uses Bureau Veritas (Gradko 50% TEA in acetone). The spreadsheet gives a factor for this method of 0.99.
The bias adjustment factor used was taken from the latest spreadsheet published on the Review and Assessment web site. Isle of Wight Council uses Bureau Veritas (Gradko 50% TEA in acetone). The spreadsheet gives a factor for this method of 0.99.
Automatic Monitoring Data
There are no automatic monitoring stations on the Isle of Wight.
Figure 2.4 Trends in Annual Mean Nitrogen Dioxide Concentration Measured at Diffusion Tube Monitoring Sites.
Please see the Updating and Screening Assessment, which included a Trend Chart.
Diffusion Tube Monitoring Data
Raw data is listed in the table in Appendix A.
Table 2.4 Results of Nitrogen Dioxide Diffusion Tubes
| Site ID | Location | Within AQMA? | Data Capture for monitoring perioda % | Data Capture for full calendar year 2009b % | Annual mean concentrations (μg/m3) | ||
| 2007 c, d | 2008 c,d | 2009 c | |||||
| A1 | 1 Example Site | N | 95 | 95 | 30.1 | 25.1 | 26.2 |
| IW10 | Lake Hill | N | | 100 | | 24.1 | 23.71 |
| IW4 | Fairlee Road S | N | | 100 | | 43.85 | |
| IW11 | Fairlee Rd N | N | 100 | 25 | | 31.12 | |
In terms of relevant exposure, Site IOW 4 is a kerbside location outside 51 Fairlee Road, Newport. The nearest relevant exposure is set back approximately 11m from this location, and will therefore experience lower concentrations than that measured by the tube. To demonstrate this a façade correction, (as set out in LAQM. TG(09)) has been applied. Using a background NO2 concentration of 12.95 µg/m3, the correction method shows the facade concentration to be 23.7 µg/m3 , which is significantly below the annual mean objective.
The second diffusion tube location on Fairlee Road, Site IOW11 on the facade of number 48, shows an estimated annual mean of 27.02 µg/m3 for 2009. Taking into account that Site IOW 11 is approximately 10 m closer to the road than the façade location calculated for Site 4, the Council is confident that the facade result for Site IOW 4 is representative of actual concentrations at this location.
2.2.2 PM10
No monitoring was undertaken in 2009.
2.2.3 Sulphur Dioxide
No monitoring was undertaken in 2009.
2.2.4 Benzene
No monitoring was undertaken in 2009.
2.2.5 Other pollutants monitored
None.
2.2.6 Summary of Compliance with AQS Objectives
| Isle of Wight Council has examined the results from monitoring in the Island. Concentrations are all below the objectives, therefore there is no need to proceed to a Detailed Assessment. |
3 New Local Developments
3.1 Road Traffic Sources
Isle of Wight Council’s Local Transport Planner reports as follows:
| Narrow congested streets with residential properties close to the kerb. | No |
| Busy streets where people may spend one hour or more close to traffic | No |
| Roads with a high flow of buses and/or HGVs | No |
| Junctions | Possibly – we have recently installed traffic lights at a 3 way junction between Downs Road and Downend Road. Prior to installation this was an unsignalled junction with traffic delays on the Downs End arm. Traffic lights were installed to deal with this issue and has resulted in a reduced queue length on Downs Road but new, small queues on the two Down End Road arms. |
| New roads constructed or proposed since the last Updating and Screening Assessment | No |
| Roads with significantly changed traffic flows | Possibly – we have increased the width of Beatrice Avenue, East Cowes from 4m to 6.5m. This increased carriageway width may increase desirability of the route and therefore increase future traffic flows. |
| Bus or coach stations | No |
Are there any other highway developments in the pipeline that may affect traffic flow, and therefore air quality?
No
Traffic Flows
(see attached spreadsheet)
Local Transport Plan
Our second Local Transport Plan (2006-2011) includes a target to have no designated AQMAs during the plan period. The LTP seeks to tackle congestion and increase accessibility by offering travel choice and promoting sustainable transport (which indirectly affects air quality). The plan does not include a specific strategy to deal with air quality in Fairlee Road.
We are currently preparing our third LTP for adoption in April 2011 and will soon be in the process of considering suitable targets.
In addition, Isle of Wight Council has recently confirmed that we have we have received approval for a Highways PFI initiative. This will result in a major programme of renewal of our worn-out road network.
Work on this is anticipated to start during 2013. A rolling programme of road closures will be needed to accomplish the necessary highway renewals, which will have the effect of changing traffic flow patterns for variable durations in different places.
The consequence may be that pollution from traffic sources will be temporarily changed, for better or for worse, for short periods.
A major development has recently been approved, which will involve the construction of 846 new houses on the outskirts of Newport. This also includes the construction of the roads to serve the housing, including junctions with existing roads.
An Environmental Statement was submitted with the application, which included consideration of the impact on Air Quality of an estimated growth in traffic consequent upon the development. Full details can be found at http://www.iwight.com/council/departments/planning/appsdip/AppDetails3.aspx?frmId=20295
The conclusion of the assessment was that there would be no likely exceedances of air quality standards as a result of the development.
3.2 Other Transport Sources
3.3 Industrial Sources
There are no new industrial sources since the 2009 USA.
3.4 Commercial and Domestic Sources
There have been no significant changes in domestic combustion. As older, non-condensing, gas boilers are replaced by newer, more efficient, less polluting boilers, it is likely that air quality will improve.
There have been two new biofuel plants approved recently:
There have been two new biofuel plants approved recently:
- Elm Farm, Calbourne. The following is taken from the isle of Wight Planning website:
| Application Ref: | TCP/29338/A, P/01802/09 |
| Location: | part OS parcel 2571 east of Elm Farm Elm Lane Calbourne Newport Isle Of Wight PO30 |
| Proposal: | Change of use of part of existing agricultural building to house bio mass generator and associated equipment with protruding exhaust stack at height of 2.9m above ridge level and associated underground cabling |
| Parish: | Calbourne |
| Ward: | West Wight |
| Easting/Northing: | 442176.5 / 88623.3 |
Planning Officer’s justification for the decision
Noise and Emissions from the Development - The Environmental Protection Officer has
commented that he has reviewed the supporting documents and also referred to the “Unit Conversion
Screening Tool” on the LAQM pages of the University of the West of England. This has been
produced on behalf of HM Government to give guidance in assessing the air quality impact of point
sources of pollutants. Having entered the relevant data (as given in the Chimney Height report from
GF Environmental, the result shows a predicted ground level concentration of pollutants that are well
below the statutory guideline limits of the Air Quality Regulations.
The current planning application will be accepted by Environmental Health as an application for a
Chimney Height Determination in accordance with section 14 of the Clean Air Act 1993. The
information supplied also satisfies the Local Authority that the requirement to fit grit arrestment plant,
in accordance with section 6 of the Act, is also satisfied. Therefore the Environmental Health Officer
concludes that the development will not have a significant adverse effect on local amenity, or on local
air quality, subject to the imposition of conditions relating to; development to be completed in
accordance with the submitted plans; chimney to be a minimum of 9 metres above ground level, and
noise measures undertaken in accordance with the recommendations of the noise report.
- Pan extension
| Application Ref: | TCP/29834, P/01373/09 |
| Location: | land to the south east of Newport between and including part of Staplers Road and St. Georges Way Newport Isle Of Wight PO30 |
| Proposal: | Residential development of 846 residential units with an associated network of roads public footpaths and cycleways including new junctions to St. Georges Way and Staplers Road. The creation of landscaping public open spaces a country park biomass centre visitors centre recycling points and rangers station (revised plans)(minor changes to onsite highway layout)(readvertised application) |
| Parish: | Newport |
| Ward: | Newport East |
| Easting/Northing: | 451007.8 / 88783.2 |
An Environmental Statement was submitted, which included consideration of Air Quality issues.
This assessment was considered by Environmental Health to be unsatisfactory, as it related to a theoretical plant, and not to plant of a particular description. The application was considered by Committee, who declined to impose any condition relating to air quality.
The impact on air quality of this proposed development is therefore currently not known. This will be addressed, and included in a subsequent Report.
3.5 New Developments with Fugitive or Uncontrolled Sources
| Isle of Wight Council has identified the following new or previously unidentified local developments which may impact on air quality in the Local Authority area. Extension to a quarry at St. George’s Down (Bardon Vectis) These will be taken into consideration in the next Updating and Screening Assessment, scheduled for 2012. |
4 Local Transport Plans and Strategies
See the Local Transport Plan 2006 – 2011 Part I “Improving Air Quality and the Environment”. This was covered in the 2009 Updating and Screening Assessment. There are no additional comments since the publication of that report.
5 Climate Change Strategies
Isle of Wight Council is a signatory to the Nottingham Convention. Work is in progress towards the publication of a Climate Change Strategy. This was due to be completed in March 2010; however, the Strategy had not yet been published by the time this report was prepared.
It is hoped to be able to report on this in next year’s Progress Report.
6 Implementation of Action Plans
There are no Air Quality Management Areas on the Island, and therefore no Action Plans.
7 Conclusions and Proposed Actions
7.1 Conclusions from New Monitoring Data
New monitoring data demonstrates that the monitored pollutant (NO2) is unlikely to exceed the guideline value, and therefore there is no need to proceed to a Detailed Assessment.
7.2 Conclusions relating to New Local Developments
New local developments have been assessed during the Planning stage for their potential impacts on local air quality. A proposed biofuel plant to provide heat and power to the proposed Pan Extension housing development has not been fully assessed. This will be addressed, and included in a subsequent report.
7.3 Proposed Actions
Continuing monitoring at roadside sites identified has identified that there is no need to proceed to a Detailed Assessment. However, there remains concerns, particularly along Fairlee Road.
NO2 diffusion tube monitoring will be continued, and results used to inform future reports.
Appendices
Appendix A: QA/QC Data
Appendix A: QA:QC Data
Diffusion Tube Bias Adjustment Factors
The various tools and spreadsheets published on the Air Quality Helpdesk web sites have been used.
The data has been checked for precision, using the spreadsheet, and found to be “good”.
IW11 was discontinued after March 2009. A period adjustment was applied, using the method in Box 3.2 of LAQM.TG(09).
Factor from Local Co-location Studies (if available)
There are no co-location studies on the Island.
Discussion of Choice of Factor to Use
The laboratory used in Bureau Veritas, using the Gradko 50% TEA in acetone method. For 2009, the Bias Adjustment Factor given in the spreadsheet is 0.99.
Short-term to Long-term Data adjustment
Using the dataset of hourly mean NO2 concentration from the Urban Background site at Portsmouth give the ratio of the averages for the months January to March inclusive over the annual mean as 0.705. Using the dataset for Bournemouth gives a ratio of 0.666. Averaging these gives 0.685.
Multiplying the 3-month average for IW11 by this ratio results in an estimated annual mean of 27.02.
Multiplying the 3-month average for IW11 by this ratio results in an estimated annual mean of 27.02.
QA/QC of diffusion tube monitoring
| Values copied from the spreadsheet published on www.airquality.co.uk | | | | ||||||||||||||||||||
| Fairlee | | | | | | | | | | ||||||||||||||
| Diffusion Tubes Measurements µgm-3 | Data Quality Check | ||||||||||||||||||||||
| Period | Start Date | End Date | Tube 1 | Tube 2 | Tube 3 | Triplicate Mean | Standard Deviation | Coefficient of Variation (CV) | 95% CI of mean | Tubes Precision Check | | ||||||||||||
| 1 | 07/01/2009 | 04/02/2009 | 46.9 | 47.1 | 48.8 | 48 | 1.1 | 2 | 2.7 | Good | | ||||||||||||
| 2 | 04/02/2009 | 05/03/2009 | 48.6 | 53.6 | 48.7 | 50 | 2.9 | 6 | 7.1 | Good | | ||||||||||||
| 3 | 05/03/2009 | 01/04/2009 | 42.0 | 45.7 | 54.7 | 47 | 6.5 | 14 | 16.2 | Good | | ||||||||||||
| 4 | 01/04/2009 | 29/04/2009 | 49.9 | 46.9 | 52.1 | 50 | 2.6 | 5 | 6.5 | Good | | ||||||||||||
| 5 | 29/04/2009 | 04/06/2009 | 37.2 | 38.5 | 40.9 | 39 | 1.9 | 5 | 4.8 | Good | | ||||||||||||
| 6 | 04/06/2009 | 01/07/2009 | 39.7 | 37.6 | 36.4 | 38 | 1.7 | 4 | 4.2 | Good | | ||||||||||||
| 7 | 01/07/2009 | 30/07/2009 | 42.4 | 40.3 | 36.8 | 40 | 2.9 | 7 | 7.1 | Good | | ||||||||||||
| 8 | 30/07/2009 | 02/09/2009 | 41.2 | 41.7 | 38.0 | 40 | 2.0 | 5 | 5.0 | Good | | ||||||||||||
| 9 | 02/09/2009 | 30/09/2009 | 41.9 | 46.6 | 48.9 | 46 | 3.6 | 8 | 8.8 | Good | | ||||||||||||
| 10 | 30/09/2009 | 04/11/2009 | 41.2 | 46.3 | 46.0 | 45 | 2.8 | 6 | 7.0 | Good | | ||||||||||||
| 11 | 04/11/2009 | 03/12/2009 | 40.2 | 42.0 | 39.3 | 41 | 1.4 | 3 | 3.4 | Good | | ||||||||||||
| 12 | 03/12/2009 | 14/01/2010 | 44.8 | 50.0 | 51.8 | 49 | 3.6 | 7 | 9.0 | Good | | ||||||||||||
| 13 | | | | | | | | | | | | ||||||||||||
| Fairlee 2 | | | | | | | | | | | |||||||||||||
| Diffusion Tubes Measurements | Data Quality Check | ||||||||||||||||||||||
| Period | Start Date | End Date | Tube 1 | Tube 2 | Tube 3 | Triplicate Mean | Standard Deviation | Coefficient of Variation (CV) | 95% CI of mean | Tubes Precision Check | | ||||||||||||
| 1 | 07/01/2009 | 04/02/2009 | 43.0 | 46.2 | 43.6 | 44 | 1.7 | 4 | 4.2 | Good | | ||||||||||||
| 2 | 04/02/2009 | 05/03/2009 | 41.1 | 39.5 | 38.1 | 40 | 1.5 | 4 | 3.7 | Good | | ||||||||||||
| 3 | 05/03/2009 | 01/04/2009 | 38.3 | 33.5 | 35.3 | 36 | 2.4 | 7 | 5.9 | Good | | ||||||||||||
Page last updated on: 08/02/2011