


| |
| Updating and Screening Assessment |
| Report to the Isle of Wight Council |
| netcen/ED49285/Issue 2 February 2004 |
| Title | Updating and Screening Assessment |
| Customer | Isle of Wight Council |
| Customer reference | |
| Confidentiality, copyright and reproduction | |
| File reference | Issue 2 |
| Reference number | AEAT/ENV/R/1631 |
Address for Jeff Lampert
E1/14
Correspondence Culham Science Park
Abingdon
Oxon
OX14 3ED
Telephone 0870 190 6514
Facsimile 0870 190 6607
netcen is a operating division of AEA Technology plc
netcen is certificated to ISO9001 & ISO 14001
| | Name | Signature | Date |
| Author | | | |
| Reviewed by | | | |
| Approved by | | | |
Executive Summary
The UK Government published its strategic policy framework for air quality management in 1995 establishing national strategies and policies on air quality which culminated in the Environment Act, 1995. The Air Quality Strategy1 provides a framework for air quality control through air quality management and air quality standards. These and other air quality standards[1] and their objectives have been enacted through the Air Quality Regulations in 1997, 2000 and 2002. The Environment Act 1995 requires Local Authorities to undertake air quality reviews. In areas where an air quality objective is not anticipated to be met, Local Authorities are required to establish Air Quality Management Areas and implement action plans to improve air quality.
The first round of air quality review and assessments has been completed by the Isle of Wight Council. The Council is now required to proceed to the second round of review and assessment in which sources of emissions to air are reassessed to identify whether the situation has changed since the first round, and if so, what impact this may have on predicted exceedences of the air quality objectives.
The second round of review and assessment is to be undertaken in two steps. The first step is an Updating and Screening Assessment, which updates the Stage 1 and 2 review and assessment previously undertaken for all pollutants identified in the Air Quality Regulations. Where a significant risk of exceedence is identified for a pollutant it will be necessary for the local authority to proceed to a Detailed Assessment, equivalent to the previous Stage 3 assessments. Where a local authority does not need to undertake a Detailed Assessment, a progress report is required instead.
This report is an Updating and Screening Assessment for the Isle of Wight Council as outlined in the Government’s published guidance.
The Isle of Wight Council has prepared Stage 1 and 2 Review and Assessment reports. The reports concluded that levels of all pollutants were likely to meet the objectives of the Strategy by the prescribed dates.
The general approach taken to this Updating and Screening Assessment was to:
- Identify the conclusions of the last round of review and assessment for each of the seven pollutants included in the air quality regulations;
- Identify significant sources of emissions to air for the seven pollutants included in the air quality regulations, including major roads and industrial plant;
- Identify new sources not previously considered in the first round of review and assessment;
- Identify any sources for which emissions have changed significantly since the last round of review and assessment;
- Identify and interpret the significance of air quality monitoring data made available since the last round of review and assessment;
- Assess the risk of exceedences of the air quality objectives in locations where relative public exposure may exist using screening models and nomograms; and
- Where necessary, identify locations and pollutants for which further detailed assessment of air quality will be required.
This updating and screening assessment has concluded that:
Carbon monoxide
There are no roads on the Isle of Wight which can be classified as ‘very busy’ with receptors within 20m.
The Isle of Wight Council is not required to carry out a Detailed Assessment for carbon monoxide.
Benzene
There are no roads on the Isle of Wight which can be classified as ‘very busy’ with receptors within 20m. There are no petrol stations with a throughput greater than 2 million litres and with relevant exposure within 10m of the pumps. The only major fuel storage depot on the Isle of Wight is the BP Oils depot in East Cowes which has a throughput of 50 million litres of petrol per annum. There are relevant receptors within 40m of the depot. According the nomograms in LAQM (TG(03) there may be a risk of exceeding the 2010 annual mean objective of 5 μg/m3.
The Isle of Wight Council is required to carry out a Detailed Assessment for benzene.
1,3-Butadiene
Estimated background concentrations and data from national monitoring stations indicate that the objective for 1,3-butadiene is likely to be achieved by the end of 2003. There are no industrial processes, current or proposed, on the Isle of Wight which have the potential to emit 1,3-butadiene.
The Isle of Wight Council is not required to carry out a Detailed Assessment for 1,3-butadiene.
Lead
Emissions of lead from industrial processes on the Isle of Wight are not likely to exceed the objectives for lead to be achieved in 2004 and 2008.
The Isle of Wight Council is not required to carry out a Detailed Assessment for lead.
Nitrogen dioxide
The DMRB screening model indicates that the 2005 annual mean objective for NO2 is unlikely be exceeded at receptors near roads on the Isle of Wight.
The Isle of Wight Council is not required to carry out a Detailed Assessment for nitrogen dioxide.
Sulphur dioxide
There are no significant industrial or domestic sources of sulphur dioxide on the Isle of Wight.
There are a more than 5,000 car ferry movements per year in each of the three main ports on the Isle of Wight.
The Isle of Wight Council is recommended to carry out a Detailed Assessment for sulphur dioxide based on car ferry emissions at the ports of Fishbourne, Cowes and Ryde.
PM10
The DMRB screening model indicates that the annual mean objective of 40 μg/m3 for PM10 will be met in 2004. The 24 hour mean objective of 50 μg/m3 is unlikely be exceeded more than 35 times a year in 2004 at locations near roads the Isle of Wight.
The Isle of Wight Council is not required to carry out a Detailed Assessment for PM10.
Contents
Appendices
APPENDIX 1 TRAFFIC DATA
APPENDIX 2 MONITORING DATA
APPENDIX 3 AUTHORISED PROCESSES
APPENDIX 4 DESCRIPTION OF DMRB MODEL
1 Screening Assessment
This section outlines the purpose of this Updating and Screening Assessment for the Isle of Wight Council, and the scope of the assessment.
1.1 PURPOSE OF THE UPDATING AND SCREENING ASSESSMENT
The first round of air quality review and assessments is now complete and all local authorities should have completed all necessary stages. Where the likelihood of exceedences of air quality objectives has been identified in areas of significant public exposure, an air quality management area should have been declared, followed by a further Stage 4 review and assessment, and the formulation of an action plan to eliminate exceedences. Local authorities are now required to proceed to the second round of review and assessment in which sources of emissions to air are reassessed to identify whether the situation has changed since the first round of review and assessment, and if so, what impact this may have on predicted exceedences of the air quality objectives. Such changes might include significant traffic growth on a major road, which had not been foreseen, construction of a new industrial plant with emissions to air, or significant changes in the emissions of an existing plant.
The second round of review and assessment is to be undertaken in two steps. The first step is an Updating and Screening Assessment, which updates the Stage 1 and 2 review and assessments previously undertaken for all pollutants identified in the Air Quality Regulations. Where a significant risk of exceedence is identified for a pollutant it will be necessary for the local authority to proceed to a Detailed Assessment, equivalent to the previous Stage 3 assessments. Where a local authority does not need to undertake a Detailed Assessment, a progress report is required instead.
1.2 OVERVIEW OF APPROACH TAKEN
The general approach taken to this Updating and Screening Assessment was to:
- ➢ Identify the conclusions of the last round of review and assessment for each of the seven pollutants included in the air quality regulations;
- ➢ Identify significant sources of emissions to air for the seven pollutants included in the air quality regulations, including major roads and industrial plant;
- ➢ Identify new sources not previously considered in the first round of review and assessment;
- ➢ Identify any sources for which emissions have changed significantly since the last round of review and assessment;
- ➢ Identify and interpret the significance of air quality monitoring data made available since the last round of review and assessment;
- ➢ Assess the risk of exceedences of the air quality objectives in locations where relative public exposure may exist using screening models and nomograms; and
- ➢ Where necessary, identify locations and pollutants for which further detailed assessment of air quality will be required.
1.3 RELEVANT defra DOCUMENTATION USED
This report takes into account the guidance in LAQM.TG(03)3, published January 2003.
1.4 POLLUTANTS CONSIDERED IN THIS REPORT
All pollutants included in the Air Quality Regulations2 for the purposes of Review and Assessment (Table 1.1) have been considered in this report.
| Table 1.1 Objectives included in the Air Quality Regulations 2000 and (Amendment) Regulations 2002 for the purpose of Local Air Quality Management | |||
| Pollutant | Air Quality Objective | Date to be achieved by | |
| Concentration | Measured as | ||
| Benzene All authorities | 16.25 μg/m3 | running annual mean | 31.12.2003 |
| Authorities in England and Wales only | 5.00 μg/m3 | annual mean | 31.12.2010 |
| Authorities in Scotland and Northern Ireland onlya | 3.25 μg/m3 | running annual mean | 31.12.2010 |
| 1,3-Butadiene | 2.25 μg/m3 | running annual mean | 31.12.2003 |
| Carbon monoxide Authorities in England, Wales and Northern Ireland onlya | 10.0 mg/m3 | maximum daily running 8-hour mean | 31.12.2003 |
| Authorities in Scotland only | 10.0 mg/m3 | running 8-hour mean | 31.12.2003 |
| Lead | 0.5 μg/m3 0.25 μg/m3 | annual mean annual mean | 31.12.2004 31.12.2008 |
| Nitrogen dioxideb | 200 μg/m3 not to be exceeded more than 18 times a year 40 μg/m3 | 1 hour mean annual mean | 31.12.2005 31.12.2005 |
| Particles (PM10) (gravimetric)c All authorities | 50 μg/m3 not to be exceeded more than 35 times a year 40 μg/m3 | 24 hour mean annual mean | 31.12.2004 31.12.2004 |
| Authorities in Scotland onlyd | 50 μg/m3 not to be exceeded more than 7 times a year 18 μg/m3 | 24 hour mean annual mean | 31.12.2010 31.12.2010 |
| Sulphur dioxide | 350 μg/m3 not to be exceeded more than 24 times a year 125 μg/m3 not to be exceeded more than 3 times a year 266 μg/m3 not to be exceeded more than 35 times a year | 1 hour mean 24 hour mean 15 minute mean | 31.12.2004 31.12.2004 31.12.2005 |
a. In Northern Ireland none of the objectives are currently in regulation. Air Quality (Northern Ireland) Regulations are scheduled for consultation early in 2003.
b. The objectives for nitrogen dioxide are provisional.
c. Measured using the European gravimetric transfer sampler or equivalent.
d. These 2010 Air Quality Objectives for PM10 apply in Scotland only, as set out in the Air Quality (Scotland) Amendment Regulations 2002.
b. The objectives for nitrogen dioxide are provisional.
c. Measured using the European gravimetric transfer sampler or equivalent.
d. These 2010 Air Quality Objectives for PM10 apply in Scotland only, as set out in the Air Quality (Scotland) Amendment Regulations 2002.
The new national particles objectives for England, Wales and Greater London are not currently included in Regulations for the purpose of LAQM. The Government and the Welsh Assembly Government however intends that the new particles objectives will be included in Regulations as soon as practicable after the review of the EU's first air quality daughter directive, which is due to be completed in 2004. The new particles objectives for England, Wales and Greater London are shown in Table 1.2. Whilst authorities have no obligation to review and assess against them, they may find it helpful to do so, in order to assist with longer-term planning, and the assessment of development proposals in their local areas. Assessment against these proposed objectives is provided in this report.
| Table 1.2: Proposed new particles objectives for England, Wales and Greater London (not included in Regulations) | |||
| Region | Air Quality Objective | Date to be achieved by | |
| Concentration | Measured as | ||
| London | 50 μg/m3 not to be exceeded more than 10 times a year | 24 hour mean | 31.12.2010 |
| London | 23 μg/m3 | annual mean | 31.12.2010 |
| London | 20 μg/m3 | annual mean | 31.12.2015a |
| Rest of England and Wales | 50 μg/m3 not to be exceeded more than 7 times a year | 24 hour mean | 31.12.2010 |
| Rest of England and Wales | 20 μg/m3 | annual mean | 31.12.2010 |
a. This objective is provisional, to be achieved only where cost-effective and proportional local action can be identified
2 The UK Air Quality Strategy
The Government prepared the Air Quality Strategy for England, Scotland, Wales and Northern Ireland for consultation in August 1999. It was published in January 2000 (DETR, 2000)3.
2.1 NATIONAL AIR QUALITY STANDARDS
At the centre of the Air Quality Strategy is the use of national air quality standards to enable air quality to be measured and assessed. These also provide the means by which objectives and timescales for the achievement of objectives can be set. These standards and associated specific objectives to be achieved between 2003 and 2010 are shown in Table 1.1.
2.1.1 Timescales to achieve the objectives for the pollutants in Air Quality Strategy
In most local authorities in the UK, objectives will be met for most of the pollutants within the timescale of the objectives shown in Table 1.1. It is important to note that the objectives for NO2 remain provisional. The Government has recognised the problems associated with achieving the standard for ozone and this will not therefore be a statutory requirement. Ozone is a secondary pollutant and transboundary in nature and it is recognised that local authorities themselves can exert little influence on concentrations when they are the result of regional primary emission patterns.
2.2 AIR QUALITY REVIEWS – THE APPROACHES AND EXPECTED OUTCOMES
Technical Guidance has been issued in ‘Review and Assessment: Technical Guidance’ LAQM.TG (03)3 to enable air quality to be monitored, modelled, reviewed and assessed in an appropriate and consistent fashion. This updating and screening assessment has considered the procedures set out in this technical guidance.
The primary objective of undertaking a review of air quality is to identify any areas that are unlikely to meet national air quality objectives and ensure that air quality is considered in local authority decision making processes. The complexity and detail required in a review depends on the risk of failing to achieve air quality objectives and it has been proposed therefore that reviews should be carried out in two steps. Both steps of review and assessment may be necessary and every authority is expected to undertake at least a first stage review and assessment of air quality in their authority area. The steps are briefly described in the following table, Table 2.1.
Table 2.1 Brief details of steps in the second Round of the Air Quality Review and Assessment process
| Level of Assessment | Objective | Approach |
| Updating and Screening | To identify those matters that have changed since the last review and assessment, which might lead to a risk of an air quality objective being exceeded | Use a checklist to identify significant changes that require further consideration. Where such changes are identified, then apply simple screening tools to decide whether there is sufficient risk of an exceedence of an objective to justify a Detailed Assessment |
| Detailed Assessment | To provide an accurate assessment of the likelihood of an air quality objective being exceeded at locations with relevant exposure. This should be sufficiently detailed to allow the designation or amendment of any necessary AQMAs | Use quality-assured monitoring and validated modelling methods to determine current and future pollutant concentrations in areas where there is a significant risk of exceeding an air quality objective. |
| Annual Progress Reports | Local authorities should prepare annual air quality Progress Reports between subsequent rounds of reviews and assessments. The concept is that this will ensure continuity in the LAQM process. | The precise format for the Progress Report has not yet been determined, but will essentially follow the checklist approach that is set out in subsequent chapters of this document. Further details on the Progress Reports will be provided via the Helpdesks by the middle of 2003. It is envisaged that these Progress Reports could be useful for the compilation of annual ‘state of the environment’ reports that many authorities already prepare. |
The deadline for completion of updating and screening assessments was May 2003, and for detailed assessments April 2004. For London Authorities who have declared an AQMA the deadline is the end of 2003.
2.3 LOCATIONS THAT THE REVIEW AND ASSESSMENT MUST CONCENTRATE ON
For the purpose of review and assessment, the authority should focus their work on locations where members of the public are likely to be exposed over the averaging period of the objective. Table 2.2 summarises the locations where the objectives should and should not apply.
Table 2.2 Typical locations where the objectives should and should not apply
| Averaging Period | Pollutants | Objectives should apply at ... | Objectives should not generally apply at ... |
|---|---|---|---|
| Annual mean |
|
|
|
| | |
|
|
| | | |
|
| 24 hour mean and 8-hour mean |
|
|
|
| | |
| |
Table 2.2 (contd.) Typical locations where the objectives should and should not apply
| Averaging Period | Pollutants | Objectives should apply at ... | Objectives should generally not apply at ... |
| 1 hour mean |
|
|
|
| | |
| |
| | |
| |
| | |
| |
| 15 minute mean |
|
| |
It is unnecessary to consider exceedences of the objectives at any location where public exposure over the relevant averaging period would be unrealistic. Locations should also represent non-occupational exposure.
3 Information used to support this assessment
This section lists the key information used in this review and assessment.
3.1 CONCLUSIONS FROM THE FIRST ROUND OF REVIEW AND ASSESSMENT OF AIR QUALITY FOR THE ISLE OF WIGHT COUNCIL
The Isle of Wight Council has completed the following review and assessments of air quality to date:
- ➢ Stage 1 April 2000
- ➢ Stage 2 June 2000
3.2 PROPOSED DEVELOPMENTS WHICH MAY AFFECT AIR QUALITY
3.2.1 Industry
No significant industrial developments have taken place or are planned on the Isle of Wight since the last Review.
3.2.2 Housing and Redevelopment
There are no current or proposed housing or other developments on the Isle of Wight which would impact on air quality.
3.2.3 Road
No new road developments have taken place or are planned for the Isle of Wight since the last Review.
3.3 MAPS AND DISTANCES OF RECEPTORS FROM ROADS
The Isle of Wight Council provided electronic OS LandLine™ maps which were used in the Geographical Information System (GIS) used in assessment. Individual buildings or groups of buildings (receptors) were identified from the electronic OS Landline maps of the areas. The distances of these receptors from the road, and the widths of the roads, were accurately determined from the maps.
The Ordnance Survey mapping included within this publication is provided by the Isle of Wight Council under licence from the Ordnance Survey in order to fulfill its public function to act as a planning authority. Unauthorised reproduction infringes Crown copyright and may lead to prosecution or civil proceedings. The Isle of Wight Licence No 076694.
.
3.4 ROAD TRAFFIC DATA
Road traffic data were collated from :
- data held in the National Atmospheric Emissions Inventory (NAEI, 2000)
- data supplied by the Isle of Wight Council
Where no average speed data were available, estimated speeds were used near receptors and junctions.
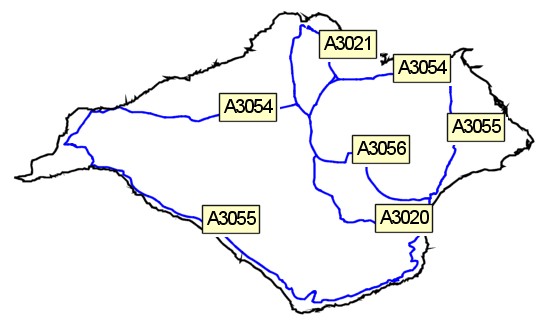
Figure 3.1 Major roads on the Isle of Wight
3.4.1 Fraction of HGVs
Percentages of Cars, LGVs, HGVs and buses were available from the count data for supplied in the NAEI 2000.
3.4.2 Base year for traffic
The base year for the traffic flows was 2000 (NAEI).
3.4.3 Traffic growth
Traffic growth figures were estimated using the TEMPRO database.
3.4.4 Distance from the centre of the road to the kerbside and to the receptors
Road widths and the distances of receptors from the road were taken from the electronic OS Landline™ of the Council area.
3.5 PART A AND B PROCESSES
According to data supplied in the Environment Agency Pollution Inventory and the Isle of Wight Council there are currently four Part A industrial processes (Appendix 2) and 53 Part B processes (listed in the Stage 1 Assessment report) on the Isle of Wight
3.6 AMBIENT MONITORING
The Isle of Wight Council undertakes monitoring of nitrogen dioxide using diffusion tubes at nine locations (Appendix A1).
4 Updating and Screening Assessment for Carbon Monoxide
4.1 THE NATIONAL PERSPECTIVE
The main source of carbon monoxide in the United Kingdom is road transport, which accounted for 67% of total releases in 2000. Annual emissions of carbon monoxide have been falling steadily since the 1970s, and are expected to continue to do so. Current projections indicate that road transport emissions will decline by a further 42% between 2000 and 2005. Existing policies will be sufficient to reduce maximum daily 8-hour mean concentrations of carbon monoxide below 10 mg/m3 by about 2003.
4.2 STANDARD AND OBJECTIVE FOR CARBON MONOXIDE
The Government and the Devolved Administrations have adopted an 8-hour running mean concentration of 11.6 mg/m3 as the air quality standard for carbon monoxide. The air quality objective has been set at a slightly tighter level of 10 mg/m3 as a maximum daily running 8-hour mean concentration, to be achieved by the end of 2003, bringing it into line with the second Air Quality Daughter Directive limit value.
4.3 CONCLUSIONS OF THE FIRST ROUND OF REVIEW AND ASSESSMENT FOR CARBON MONOXIDE
The Stage 1 Review and Assessment concluded that the risk of exceeding the air quality objective may be considered negligible and no further action is required.
4.4 SCREENING ASSESSMENT OF CARBON MONOXIDE
The Technical Guidance LAQM TG(03) requires assessment of carbon monoxide to consider the following sources, data or locations:
- ➢ Monitoring Data
- ➢ Very Busy Roads
These are described in the following sections.
4.5 BACKGROUND CONCENTRATIONS FOR CARBON MONOXIDE
The average background carbon monoxide concentration estimated from the UK background maps6 was 0.20 mg/m3 on the Isle of Wight with maximum concentration of 0.26 mg/m3.
4.6 SCREENING ASSESSMENT OF MONITORING DATA
Carbon monoxide is not monitored on the Isle of Wight. However, there were no exceedances of the 2003 CO objective anywhere in the UK in 2002.
4.7 SCREENING ASSESSMENT OF VERY BUSY ROADS
The guidance document LAQM TG(03)3 requires assessment of CO only at ‘very busy roads’. Traffic flow data from the NAEI and traffic counts made by the Council indicate that there are no very busy roads on the Isle of Wight according to the classification given in LAQM TG (03).
4.8 CONCLUSIONS FOR CARBON MONOXIDE CONCENTRATIONS ON THE ISLE OF WIGHT
There are no very busy roads on the Isle of Wight. National monitoring data indicate that exceedances of the CO objective are unlikely anywhere in the UK.
The Isle of Wight Council is not required to carry out a Detailed Assessment for carbon monoxide.
The Isle of Wight Council is not required to carry out a Detailed Assessment for carbon monoxide.
5 Updating and Screening Assessment for Benzene
5.1 THE NATIONAL PERSPECTIVE
The main sources of benzene emissions in the UK are petrol-engined vehicles, petrol refining, storage and the distribution and uncontrolled emissions from petrol station forecourts without vapour recovery systems. A number of policy measures already in place, or planned for future years, will continue to reduce emissions of benzene. Since January 2000, EU legislation has reduced the maximum benzene content of petrol to 1%, from a previous upper limit of 5%. The European Auto-Oil programme will further reduce emissions for cars and light-duty vehicles, and emissions of benzene from the storage and distribution of petrol are controlled by vapour recovery systems. Forecasts based on national mapping suggest that the policy measures currently in place will achieve the 2003 objective at all urban background and roadside/kerbside locations. Whilst the 2010 objectives are expected to be met at all urban background, and most roadside locations, there is the possibility for some remaining exceedences which will require additional measures at a local level.
5.2 STANDARD AND OBJECTIVE FOR BENZENE
The Government and the Devolved Administrations have adopted a running annual mean concentration of 16.25 µg/m3 as the air quality standard for benzene, with an objective for the standard to be achieved by the end of 2003. However, in light of the health advice from EPAQS and the Department of Health’s Committee on Carcinogenicity of Chemicals in Food, Consumer Products and the Environment (COC) to reduce concentrations of benzene in air to as low a level as possible, additional tighter objectives have also been set. The additional objective is for an annual mean of 5 µg/m3 to be achieved by the end of 2010 in England and Wales. In Scotland and Northern Ireland, a running annual mean of 3.25 µg/m3 has been adopted as an additional objective, to be achieved by the end of 2010.
5.3 CONCLUSIONS OF THE FIRST ROUND OF REVIEW AND ASSESSMENT FOR BENZENE
The First Stage Review and Assessment for the Isle of Wight concluded that there were no significant industrial or other sources of benzene in the Island and monitoring studies indicate that emissions from the Fawley petrol refinery in Southampton water will not significantly impact on the Island. The objective for benzene will not be exceeded on the Isle of Wight.
5.4 SCREENING ASSESSMENT OF BENZENE
The Technical Guidance LAQM TG(03)3 requires assessment of benzene to consider the following sources, data or locations:
- ➢ Monitoring Data
- ➢ Very Busy Roads or Junctions in Built-up Areas
- ➢ Industrial Sources
- ➢ Petrol Stations
- ➢ Major Fuel Storage Depots (Petroleum only)
These are described in the following sections.
5.5 BACKGROUND CONCENTRATIONS FOR BENZENE
The average background benzene concentration on the Isle of Wight, estimated from the UK background maps6 for 2001 was 0.2 μg/m3, with maximum concentration of 0.4 μg/m3.
5.6 SCREENING ASSESSMENT OF MONITORING DATA
Benzene is not monitored on the Isle of Wight.
There is a roadside monitoring station at London Marylebone Road which is indicative of the concentrations experienced at busy roadside locations. The concentrations measured at this station have decreased consistently since 1998 and current annual means are below the 2010 running annual mean objective value for England and Wales of 5 μgm-3 (Table 5.1).
Table 5.1 Benzene measurements made at London Marylebone Rd
| Year | Benzene µg m-3 |
| 1998 | 12.8 |
| 1999 | 10.8 |
| 2000 | 6.3 |
| 2001 | 4.5 |
| 2002 | 3.5 |
5.7 SCREENING ASSESSMENT OF VERY BUSY ROADS
The guidance document LAQM TG(03)3 requires assessment of benzene only at ‘very busy roads’. Traffic flow data from the NAEI and traffic counts made by the Council indicate that there are no very busy roads on the Isle of Wight according to the classification given in LAQM TG (03).
5.8 SCREENING ASSESSMENT OF INDUSTRIAL SOURCES
According to information from the Environment Agency Pollution Inventory and the Council, none of the Authorised processes on the Isle of Wight emit significant amounts benzene.
There are no new industrial sources or existing industrial sources with significantly increased emissions since the last review.
There are no new industrial sources or existing industrial sources with significantly increased emissions since the last review.
5.9 SCREENING ASSESSMENT OF PETROL STATIONS
There are no petrol stations on the Isle of Wight which have a throughput of more than 2 million litres per annum and are in the vicinity of a busy road.
5.10 SCREENING ASSESSMENT OF FUEL STORAGE DEPOTS
The only major fuel storage depot on the Isle of Wight is the BP Oils depot in East Cowes which has a throughput of 50 million litres of petrol per annum. This facility was considered in the Stage 1 Review and Assessment and any emissions not considered to have a significant impact on local air quality. The National Atmospheric Emissions Inventory provides an estimated an emission of 31Kg of benzene per annum from the depot . Using the nomograms in LAQM TG(03) if there are any relevant receptors at a distance of up to 20m from the depot, assuming a ground level emission, then a detailed assessment is required . In 2010 if there are any relevant receptors at a distance of up to 50m, assuming a ground level emission, then a detailed assessment is required. There is a new housing development, at East Cowes Marina, immediately to the north of the Fuel Depot,with dwellings within 40 m of the depot. There are relevant receptors within 40m of the depot A detailed assessment of benzene against the 2010 objective is therefore required.
5.11 CONCLUSIONS FOR BENZENE CONCENTRATIONS ON THE ISLE OF WIGHT
There are no roads on the Isle of Wight which can be classified as ‘very busy’ with receptors within 20m. There are no petrol stations with a throughput greater than 2 million litres and with relevant exposure within 10m of the pumps.
The only major fuel storage depot on the Isle of Wight is the BP Oils depot in East Cowes which has a throughput of 50 million litres of petrol per annum. There are relevant receptors within 40m of the depot.
The Isle of Wight Council is required to carry out a Detailed Assessment for benzene.
The only major fuel storage depot on the Isle of Wight is the BP Oils depot in East Cowes which has a throughput of 50 million litres of petrol per annum. There are relevant receptors within 40m of the depot.
The Isle of Wight Council is required to carry out a Detailed Assessment for benzene.
6 Updating and Screening Assessment for 1,3-Butadiene
6.1 THE NATIONAL PERSPECTIVE
The main source of 1,3-butadiene in the United Kingdom is emissions from motor vehicle exhausts. 1,3-butadiene is also an important industrial chemical and is handled in bulk at a small number of industrial premises. Maximum running annual mean concentrations of 1,3-butadiene measured at all urban background/centre and roadside locations in the national network are already well below the 2003 objective of 2.25 µg/m3. The increasing numbers of vehicles equipped with three way catalysts will significantly reduce emissions of 1,3-butadiene in future years. Recently agreed further reductions in vehicle emissions and improvements to fuel quality are expected to further reduce emissions of 1,3-butadiene from vehicle exhausts. These measures are expected to deliver the air quality objective by the end of 2003.
6.2 STANDARD AND OBJECTIVE FOR 1,3-BUTADIENE
The Government and the Devolved Administrations have adopted a maximum running annual mean concentration of 2.25 µg/m3 as an air quality standard for 1,3-butadiene. The objective is for the standard to be achieved by the end of 2003.
6.3 CONCLUSIONS OF THE FIRST ROUND OF REVIEW AND ASSESSMENT FOR 1,3-BUTADIENE
The First Stage Review and Assessment for the Isle of Wight concluded that there were no significant industrial or other sources of 1,3-butadiene in the Island or surrounding locations and that the objective for the objective for 1,3-butadiene will not be exceeded on the Isle of Wight.
6.4 SCREENING ASSESSMENT OF 1,3-BUTADIENE
The Technical Guidance LAQM TG(03) requires assessment of 1,3-butadiene to consider the following sources, data or locations:
- ➢ Monitoring Data
- ➢ New Industrial Sources
- ➢ Existing Industrial Sources with Significantly Increased Emissions
These are described in the following sections.
6.5 BACKGROUND CONCENTRATIONS FOR 1,3-BUTADIENE
The average background 1,3-butadiene concentration in 2001 estimated from the UK background maps6 was 0.08 μg/m3 on the Isle of Wight with maximum concentration of 0.14 μg/m3 .
6.6 SCREENING ASSESSMENT OF MONITORING DATA
No monitoring of 1,3-butadiene has been undertaken on the Isle of Wight. There is a roadside monitoring station at London Marylebone Road which is indicative of the concentrations experienced at busy roadside locations. The concentrations measured at this station have decreased consistently since 1998 and current annual means are below the 2003 running annual mean objective value for England and Wales of 2.25 μg/m3 (Table 6.1).
Table 6.1 1,3-butadiene measurements made at London Marylebone Rd
| Year | 1,3-bd µg/m3 |
| 1998 | 2.4 |
| 1999 | 1.9 |
| 2000 | 1.6 |
| 2001 | 1.1 |
| 2002 | 0.9 |
6.7 SCREENING ASSESSMENT OF INDUSTRIAL SOURCES
According to information from the Environment Agency Pollution Inventory and the Council, none of the Authorised processes on the Isle of Wight emit 1,3-butadiene.
There are no new industrial sources or existing industrial sources with significantly increased emissions since the last review.
There are no new industrial sources or existing industrial sources with significantly increased emissions since the last review.
6.8 CONCLUSIONS FOR 1,3-BUTADIENE CONCENTRATIONS ON THE ISLE OF WIGHT
Estimated background concentrations and data from national monitoring stations indicate that the objective for 1,3-butadiene is likely to be achieved by the end of 2003. There are no industrial processes, current or proposed, on the Isle of Wight which have the potential to emit 1,3-butadiene.
The Isle of Wight Council is not required to carry out a Detailed Assessment for 1,3-butadiene.
The Isle of Wight Council is not required to carry out a Detailed Assessment for 1,3-butadiene.
7 Updating and Screening Assessment for Lead
7.1 THE NATIONAL PERSPECTIVE
The agreement reached between the European Parliament and the Environment Council on the Directive on the Quality of Petrol and Diesel Fuels (part of the Auto-Oil Programme) has led to the ban on sales of leaded petrol in the United Kingdom with effect from 1 January 2000. Emissions of lead are now restricted to a variety of industrial activities, such as battery manufacture, pigments in paints and glazes, alloys, radiation shielding, tank lining and piping.
Detailed assessments of the potential impact of lead emissions from industrial processes have been undertaken by the Government and the Devolved Administrations, based upon both monitoring and sector analysis studies. The former has included a 12-month monitoring survey in the vicinity of 30 key industrial sites in the UK, which has been used to supplement information already provided from the non-automatic monitoring networks. These monitoring data have generally indicated no exceedances of the 2004 or 2008 objectives, although locations in proximity to non-ferrous metal production and foundry processes were deemed to be at risk.
7.2 STANDARD AND OBJECTIVE FOR LEAD
The Government and the Devolved Administrations have adopted an annual mean concentration of 0.5 µg/m3 as the air quality standard for lead, with an objective for the standard to be achieved by the end of 2004. In addition, a lower air quality objective of 0.25 µg/m3 to be achieved by the end of 2008 has also been set.
7.3 CONCLUSIONS OF THE FIRST ROUND OF REVIEW AND ASSESSMENT FOR LEAD
The Stage 1 Review and Assessment for the Isle of Wight concluded that there were no significant industrial or other sources of lead in the Island or surrounding locations, and that the objective for the objective for lead will not be exceeded on the Isle of Wight.
7.4 SCREENING ASSESSMENT OF LEAD
The Technical Guidance LAQM TG(03) requires assessment of lead to consider the following sources, data or locations:
- ➢ Monitoring Data outside an AQMA
- ➢ New Industrial Sources
- ➢ Existing Industrial Sources with Significantly Increased Emissions
These are described in the following sections.
7.5 SCREENING ASSESSMENT OF MONITORING DATA
No monitoring of lead has been undertaken on the Isle of Wight.
7.6 SCREENING ASSESSMENT OF INDUSTRIAL SOURCES
According to information from the Environment Agency Pollution Inventory and the Council, none of the Authorised processes on the Isle of Wight emit lead.
There are no new industrial sources or existing industrial sources with significantly increased emissions since the last review.
There are no new industrial sources or existing industrial sources with significantly increased emissions since the last review.
7.7 CONCLUSIONS FOR LEAD CONCENTRATIONS IN THE ISLE OF WIGHT
Emissions of lead from industrial processes on the Isle of Wight are not likely to exceed the objectives for lead to be achieved in 2004 and 2008.
The Isle of Wight Council is not required to carry out a Detailed Assessment for lead.
8 Updating and Screening Assessment for Nitrogen Dioxide
8.1 THE NATIONAL PERSPECTIVE
The principal source of NOx emissions is road transport, which accounted for about 49% of total UK emissions in 2000. Major roads carrying large volumes of high-speed traffic (such as motorways and other primary routes) are a predominant source, as are conurbations and city centres with congested traffic. Within most urban areas, the contribution of road transport to local emissions will be much greater than for the national picture.
Meeting the annual mean objective in 2005, and the limit value in 2010, is expected to be considerably more demanding than achieving the 1-hour objective. National studies have indicated that the annual mean objective is likely to be achieved at all urban background locations outside of London by 2005, but that the objective may be exceeded more widely at roadside sites throughout the UK in close proximity to busy road links. Projections for 2010 indicate that the EU limit value may still be exceeded at urban background sites in London, and at roadside locations in other cities.
Meeting the annual mean objective in 2005, and the limit value in 2010, is expected to be considerably more demanding than achieving the 1-hour objective. National studies have indicated that the annual mean objective is likely to be achieved at all urban background locations outside of London by 2005, but that the objective may be exceeded more widely at roadside sites throughout the UK in close proximity to busy road links. Projections for 2010 indicate that the EU limit value may still be exceeded at urban background sites in London, and at roadside locations in other cities.
8.2 STANDARDS AND OBJECTIVES FOR NITROGEN DIOXIDE
The Government and the Devolved Administrations have adopted two Air Quality Objectives for nitrogen dioxide, as an annual mean concentration of 40 µg/m3, and a 1-hour mean concentration of 200 µg/m3 not to be exceeded more than 18 times per year. The objectives are to be achieved by the end of 2005.
8.3 CONCLUSIONS OF THE FIRST ROUND OF REVIEW AND ASSESSMENT FOR NITROGEN DIOXIDE
The Stage 2 Review and Assessment report concluded that the annual average and hourly NO2 objectives will not be exceeded at relevant locations on the Isle of Wight and a more detailed review is not required.
8.4 SCREENING ASSESSMENT OF NITROGEN DIOXIDE
The Technical Guidance LAQM TG(03)3 requires assessment of nitrogen dioxide to consider the following sources, data or locations:
- ➢ Monitoring data outside an AQMA
- ➢ Monitoring data within an AQMA
- ➢ Narrow congested streets with residential properties close to the kerb
- ➢ Junctions
- ➢ Busy streets where people may spend 1-hour or more close to traffic
- ➢ Roads with high flow of buses and/or HGVs
- ➢ New roads constructed or proposed since first round of review and assessment
- ➢ Roads close to the objective during the first round of review and assessment
- ➢ Roads with significantly changed traffic flows
- ➢ Bus Stations
- ➢ New industrial sources
- ➢ Industrial sources with substantially increased emissions
- ➢ Aircraft
These are evaluated in the following sections.
8.5 BACKGROUND CONCENTRATIONS FOR NITROGEN DIOXIDE
The estimated average background nitrogen dioxide concentration for 2001 was 13 μg/m3 on the Isle of Wight with a maximum concentration of 19 μg/m3.
8.6 SCREENING ASSESSMENT OF MONITORING DATA
8.6.1 Monitoring data within/outside AQMAs
The Isle of Wight has not declared any AQMAs.
8.6.2 Diffusion tube monitoring
The Isle of Wight Council carries out monitoring of NO2 by diffusion tubes at 9 locations on the Isle of Wight (Table 8.1, Figure 8.1). The tubes are supplied by Stanger Science and analysed by GradKo Ltd.
Table 8.1 NO2 Diffusion Tube Locations
| No | Name | Type* | East | North |
| IW4 | Sandown High School | B | 458600 | 84600 |
| IW5 | Ryde High School | B | 458300 | 91800 |
| IW1 | Carisbrooke Castle | B | 448400 | 88800 |
| IW2 | Cowes High School | B | 449100 | 94800 |
| IW3 | Medina High School | K | 450800 | 90400 |
| IW6 | Newport Road Cowes | K | 449200 | 91500 |
| IW7 | Fairlee Road Newport | K | 450400 | 98500 |
| IW8 | Blackwater Service Station | K | 450700 | 86500 |
| IW9 | lake Hill Sandown | K | 459200 | 83700 |
*B=Background
K=Kerbside
.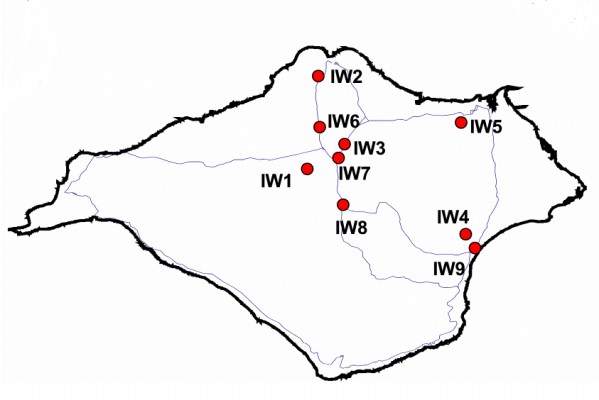
Figure 8.1 Diffusion Tube monitoring sites on the Isle of Wight
8.6.3 Bias correction of diffusion tube data
There are no intercomparison data available to estimate a bias correction factor for the diffusion tube results. The tubes are analysed by GradKo, and the result of the national NO2 intercomparison exercise December 2002 – April 2003 indicate that Gradko overestimate concentrations by up to 20%. The bias adjustment factors provided on the Review and Assessment web site indicate that a 1.28 may be applicable. To provide a conservative estimate of NO2 of concentrations the NO2 annual mean have been multiplied by 1.28
8.6.3 Future Year Estimates
From Guidance LAQM TG(03)3 the adjustment factors to estimate annual average concentrations in 2005 from 2002 are 0.92 at roadside sites and 0.93 background sites.
Table 8.2 Annual Mean Nitrogen Dioxide Concentrations Isle of Wight Sites μg/m3
Bias corrected
Bias corrected
| Site | Type | NO2 2002 | NO2 2005 |
|---|
| IW1 | B | 11 | 11 |
| IW2 | B | 13 | 12 |
| IW3 | K | 24 | 22 |
| IW4 | B | 36 | 34 |
| IW5 | B | 17 | 16 |
| IW6 | K | 15 | 14 |
| IW7 | K | 10 | 9 |
| IW8 | K | 37 | 34 |
| IW9 | K | 16 | 15 |
K=Roadside
B=Background
Annual average concentrations measured at on the Isle of Wight in 2002 were below the 40 μg/m3 annual average objective value and predicted to still be below 40 μg/m3 by 2005.
8.6.5 Automatic Monitoring
No automatic monitoring of NO2 has been undertaken on the Isle of Wight.
8.7 SCREENING ASSESSMENT OF ROAD TRAFFIC SOURCES
NO2 concentrations from road traffic for 2005 were estimated using the DMRB model (Table 8.3). Traffic flow data were taken from the NAEI 2000. A traffic growth factor of 1.11 to 2005 was used, calculated from the TEMPRO database.
Table 8.3 Estimated NO2 concentrations near A roads on the Isle of Wight (NAEI Data)
| Road | East | North | Distance to Road centre m | AADT 2005 | Speed km/h | % HDV | NO2 2005 μg/m3 |
|---|
| A3020 | 450000 | 89500 | 5 | 27197 | 60 | 4.4 | 24.8 |
| A3020 | 455000 | 81700 | 5 | 7445 | 60 | 4.2 | 20.2 |
| A3020 | 449600 | 95000 | 5 | 5938 | 60 | 3.2 | 19.2 |
| A3020 | 450600 | 86900 | 5 | 19436 | 60 | 5.6 | 24.6 |
| A3020 | 450300 | 89000 | 5 | 14817 | 60 | 4.7 | 23.4 |
| A3021 | 451060 | 95000 | 5 | 8660 | 60 | 4.5 | 20.8 |
| A3021 | 452000 | 92461 | 5 | 13502 | 60 | 4.9 | 23.0 |
| A3021 | 450400 | 95590 | 5 | 2180 | 60 | 4.0 | 17.8 |
| A3021 | 450200 | 95550 | 5 | 8720 | 60 | 4.0 | 20.6 |
| A3021 | 450250 | 95640 | 5 | 6540 | 60 | 4.0 | 19.7 |
| A3021 | 451919 | 91906 | 5 | 3285 | 60 | 4.9 | 18.4 |
| A3054 | 440000 | 89160 | 5 | 6210 | 60 | 5.5 | 20.0 |
| A3054 | 459201 | 92640 | 5 | 7650 | 60 | 4.6 | 20.4 |
| A3054 | 433400 | 88000 | 5 | 2957 | 60 | 6.1 | 18.5 |
| A3054 | 452000 | 91724 | 5 | 19653 | 60 | 2.9 | 22.9 |
| A3054 | 455000 | 92060 | 5 | 18468 | 60 | 4.6 | 23.9 |
| A3054 | 456000 | 92330 | 5 | 17638 | 60 | 4.2 | 23.5 |
| A3054 | 458930 | 92540 | 5 | 7147 | 60 | 3.7 | 19.9 |
| A3054 | 459100 | 92520 | 5 | 7147 | 60 | 3.7 | 19.9 |
| A3054 | 452239 | 92036 | 5 | 11002 | 60 | 6.5 | 22.7 |
| A3054 | 450800 | 90400 | 5 | 19664 | 60 | 4.3 | 23.8 |
| A3055 | 450000 | 76250 | 5 | 1913 | 60 | 3.5 | 17.6 |
| A3055 | 458500 | 82000 | 5 | 7498 | 60 | 4.0 | 20.1 |
| A3055 | 459950 | 92710 | 5 | 7853 | 60 | 3.4 | 20.1 |
| A3055 | 459260 | 92580 | 5 | 6936 | 60 | 5.4 | 20.3 |
| A3055 | 456400 | 77600 | 5 | 1635 | 60 | 3.9 | 17.5 |
| A3055 | 456400 | 77510 | 5 | 1635 | 60 | 3.9 | 17.5 |
| A3055 | 457470 | 80000 | 5 | 2180 | 60 | 4.8 | 17.9 |
| A3056 | 455000 | 84240 | 5 | 14190 | 60 | 4.8 | 23.3 |
| A3201 | 450350 | 95550 | 5 | 6540 | 60 | 4.0 | 19.7 |
This DMRB screening model run indicates that the 2005 annual mean objective for NO2 is unlikely to be exceeded at receptors close to A roads on the Isle of Wight.
A further DMRB model run was undertaken using local traffic data and receptor distances calculated from the OS Landline maps (Table 8.4).
A further DMRB model run was undertaken using local traffic data and receptor distances calculated from the OS Landline maps (Table 8.4).
Table 8.3 Estimated NO2 concentrations near A roads on the Isle of Wight (IoW Data)
| Town | Road | Distance to Road centre m | AADT 2005 | Speed km/h | % HDV | NO2 2005 μg/m3 |
| Ryde | St Johns Hill | 14 | 13837 | 48 | 6 | 15.8 |
| Newport | Fairlee Road | 12.8 | 13560 | 48 | 6 | 15.9 |
| Newport | Fairlee Road | 12.8 | 25234 | 48 | 6 | 17.7 |
| Newport | Horsebridge Hill | 10.5 | 29771 | 48 | 6 | 18.7 |
| Newport | Forest Road | 12 | 14188 | 48 | 6 | 16.2 |
| Sandown | Broadway | 6 | 14965 | 48 | 6 | 17.4 |
| East Cowes | Whippingham Road | 6.6 | 19987 | 48 | 6 | 18.2 |
| Newport | Medina Way | 25 | 37494 | 48 | 6 | 16.6 |
| Shanklin | Sandown Road | 10.7 | 23968 | 48 | 6 | 18.0 |
| Lake | Newport Road | 9.6 | 17667 | 48 | 6 | 17.4 |
| Newport | Forest Road | 12 | 15844 | 48 | 6 | 10.4 |
| Wootton | High Street | 11 | 22247 | 48 | 6 | 17.7 |
| Lake | Lake Hill | 9.8 | 26343 | 48 | 6 | 18.4 |
This DMRB screening model run also indicates that the 2005 annual mean objective for NO2 is unlikely to be exceeded at receptors close to A roads on the Isle of Wight.
8.7.1 Narrow congested streets with residential properties close to the kerb
There are no roads on the Isle of Wight meeting this description.
8.7.2 Busy Junctions
There are no junctions on the Isle of Wight with flows of more than 10000 vehicles per day and relevant receptors within 10m.
8.7.3 Busy streets where people may spend 1-hour or more close to traffic
There are no roads on the Isle of Wight meeting this description.
8.7.4 New roads constructed or proposed since first round of review and assessment
There are no new roads on the Isle of Wight proposed or constructed since the last Review and Assessment.
8.7.5 Roads with significantly changed traffic flows
There are no roads on the Isle of Wight with significantly increased traffic flows since the last Review and Assessment.
8.8 SCREENING ASSESSMENT OF INDUSTRIAL SOURCES
There are no new industrial sources or existing industrial sources with significantly increased emissions since the last review.
8.9 SCREENING ASSESSMENT OF OTHER TRANSPORT SOURCES
8.9.1 Bus Stations
There are no bus stations on the Isle of Wight with more than 1000 buses per day.
8.9.2 Airports
There are no airports with a throughput of 5 million passengers per year in or near the Isle of Wight.
8.10 CONCLUSIONS FOR NITROGEN DIOXIDE CONCENTRATIONS ON THE ISLE OF WIGHT
The DMRB screening model indicates that the 2005 annual mean objective for NO2 is unlikely be exceeded at receptors near roads on the Isle of Wight.
The Isle of Wight Council is not required to carry out a Detailed Assessment for nitrogen dioxide.
9 Updating and Screening Assessment for Sulphur Dioxide
9.1 THE NATIONAL PERSPECTIVE
The main source of sulphur dioxide in the United Kingdom is power stations, which accounted for more than 71% of emissions in 2000. There are also significant emissions from other industrial combustion sources. Domestic sources now only account for 4% of emissions, but can be locally much more significant. Road transport currently accounts for less than 1% of emissions.
Local exceedences of the objectives (principally the 15-minute mean objective) may occur in the vicinity of small combustion plant (less than 20 MW) which burn coal or oil, in areas where solid fuels are the predominant form of domestic heating, and in the vicinity of major ports.
9.2 STANDARD AND OBJECTIVE FOR SULPHUR DIOXIDE
The Government and the Devolved Administrations have adopted a 15-minute mean of 266 µg/m3 as an air quality standard for sulphur dioxide, with an objective for the standard not to be exceeded more than 35 times in a year by the end of 2005.
Additional objectives have also been set which are equivalent to the EU limit values specified in the First Air Quality Daughter Directive. These are for a 1-hour mean objective of 350 µg/m3, to be exceeded no more than 24 times per year, and a 24-hour objective of 125 µg/m3, to be exceeded no more than 3 times per year, to be achieved by the end of 2004.
Additional objectives have also been set which are equivalent to the EU limit values specified in the First Air Quality Daughter Directive. These are for a 1-hour mean objective of 350 µg/m3, to be exceeded no more than 24 times per year, and a 24-hour objective of 125 µg/m3, to be exceeded no more than 3 times per year, to be achieved by the end of 2004.
9.3 CONCLUSIONS OF THE FIRST ROUND OF REVIEW AND ASSESSMENT FOR SULPHUR DIOXIDE
The Stage 2 Review and Assessment report concluded that the annual average and hourly SO2 objectives will not be exceeded at relevant locations on the Isle of Wight and a more detailed review is not required.
9.4 SCREENING ASSESSMENT OF SULPHUR DIOXIDE
The Technical Guidance LAQM TG(03) requires assessment of sulphur dioxide to consider the following sources, data or locations:
- ➢ Monitoring data within an AQMA
- ➢ New industrial sources
- ➢ Industrial sources with substantially increased emissions
- ➢ Areas of domestic coal burning
- ➢ Small boilers (>5MW (thermal) ) burning coal or oil
- ➢ Shipping
- ➢ Railway Locomotives
These are evaluated in the following sections.
9.5 BACKGROUND CONCENTRATIONS FOR SULPHUR DIOXIDE
The estimated average background sulphur dioxide concentration for 2001 was 2.6 μg/m3 with maximum concentration of 7.9 μg/m3 .
9.6 SCREENING ASSESSMENT OF MONITORING DATA
Sulphur Dioxide is not monitored on the Isle of Wight.
9.7 SCREENING ASSESSMENT OF INDUSTRIAL SOURCES
Two of the Part A processes emit SO2. Both of these were examined in detail in the Stage 2 report and there have been no changes to these processes since then.
There are no new industrial sources or existing industrial sources with significantly increased emissions since the last review.
There are no new industrial sources or existing industrial sources with significantly increased emissions since the last review.
9.7.1 Small Boilers
There are no small boiler (>5 MWthermal) plants on the Isle of Wight
9.8 DOMESTIC COAL BURNING
According to information supplied by the Isle of Wight Council there are no areas of the Isle of Wight where there are significant areas of domestic coal burning as a source of sulphur dioxide.
9.9 SCREENING ASSESSMENT OF OTHER TRANSPORT SOURCES
9.9.1 Railways
According to information supplied by the Isle of Wight Council there are no areas where railway engines are run for more than 15 minutes continuously and where members of the public might be exposed.
9.9.2 Shipping
There are three car ferry terminals on the Isle of Wight with significant numbers (>5000) of shipping movements per year (Table 9.1).
Table 9.1 Isle of Wight Shipping Movements 2003
| Port | Shipping Line | Ship movements per year |
| Fishbourne | Wightlink | 25,300 |
| Yarmouth | Wightlink | 15,000 |
| Cowes | Red Funnel | 23,400 |
There are relevant receptors within 1km of these ports. Based on the guidance given in LAQM TG(03) and advice from the operator of the Pollutant Specific Helpdesk, the shipping emission could lead to exceedences of the 15 minute objective and therefore a Detailed Assessment should be undertaken to quantify the impact on ship emission on local receptors.
Shipping emissions were not addressed in the Stage 2 Review and Assessment.
9.10 CONCLUSIONS FOR SULPHUR DIOXIDE CONCENTRATIONS ON THE ISLE OF WIGHT
There are no significant industrial or domestic sources of sulphur dioxide on the Isle of Wight.
There are a more than 5,000 car ferry movements per year in the three main ports on the Isle of Wight. The Isle of Wight Council is required to carry out a Detailed Assessment for sulphur dioxide based on car ferry emissions at the ports of Fishbourne, Cowes and Yarmouth.
10 Updating and Screening Assessment for PM10
10.1 THE NATIONAL PERSPECTIVE
National UK emissions of primary PM10 have been estimated as totalling 184,000 tonnes in 1997. Of this total, around 25% was derived from road transport sources. It should be noted that, in general, the emissions estimates for PM10 are less accurate than those for the other pollutants with prescribed objectives, especially for sources other than road transport.
The Government established the Airborne Particles Expert Group (APEG) to advise on sources of PM10 in the UK and current and future ambient concentrations. Their conclusions were published in January 1999 (APEG, 1999). APEG concluded that a significant proportion of the current annual average PM10 is due to the secondary formation of particulate sulphates and nitrates, resulting from the oxidation of sulphur and nitrogen oxides. These are regional scale pollutants and the annual concentrations do not vary greatly over a scale of tens of kilometres. There are also natural or semi-natural sources such as wind-blown dust and sea salt particles. The impact of local urban sources is superimposed on this regional background. Such local sources are generally responsible for winter episodes of hourly mean concentrations of PM10 above 100 μg/m3 associated with poor dispersion. However, it is clear that many of the sources of PM10 are outside the control of individual local authorities and the estimation of future concentrations of PM10 are in part dependent on predictions of the secondary particle component.
The Government established the Airborne Particles Expert Group (APEG) to advise on sources of PM10 in the UK and current and future ambient concentrations. Their conclusions were published in January 1999 (APEG, 1999). APEG concluded that a significant proportion of the current annual average PM10 is due to the secondary formation of particulate sulphates and nitrates, resulting from the oxidation of sulphur and nitrogen oxides. These are regional scale pollutants and the annual concentrations do not vary greatly over a scale of tens of kilometres. There are also natural or semi-natural sources such as wind-blown dust and sea salt particles. The impact of local urban sources is superimposed on this regional background. Such local sources are generally responsible for winter episodes of hourly mean concentrations of PM10 above 100 μg/m3 associated with poor dispersion. However, it is clear that many of the sources of PM10 are outside the control of individual local authorities and the estimation of future concentrations of PM10 are in part dependent on predictions of the secondary particle component.
10.2 STANDARD AND OBJECTIVE FOR PM10
The Government and the Devolved Administrations have adopted two Air Quality Objectives for fine particles (PM10 ), which are equivalent to the EU Stage 1 limit values in the first Air Quality Daughter Directive. The objectives are 40 µg/m3 as the annual mean, and 50 µg/m3 as the fixed 24-hour mean to be exceeded on no more than 35 days per year, to be achieved by the end of 2004. In addition there are objectives of 50 µg/m3 as the fixed 24-hour mean to be exceeded on no more than 7 days per year, and 18 µg/m3 as the annual mean to be achieved by the end of 2010 which applies to Scottish Authorities only. There are provisional PM10 objectives for England, Wales and Northern Ireland to be achieved by 2010. The Objective for England (outside London) Wales and Northern Ireland is 50 µg/m3 as the fixed 24-hour mean to be exceeded on no more than 7 days per year, and 20 µg/m3 as the annual mean The objectives are based upon measurements carried out using the European gravimetric transfer reference sampler or equivalent.
10.3 CONCLUSIONS OF THE FIRST ROUND OF REVIEW AND ASSESSMENT FOR PM10
The Stage 2 Review and Assessment report concluded that the annual average and hourly PM10 objectives will not be exceeded at relevant locations on the Isle of Wight and a more detailed review is not required.
10.4 SCREENING ASSESSMENT OF PM10
The Technical Guidance LAQM TG(03)3 requires assessment of PM10 to consider the following sources, data or locations:
- ➢ Monitoring data outside an AQMA
- ➢ Monitoring data within an AQMA
- ➢ Busy roads and junctions
- ➢ Junctions
- ➢ Roads with high flow of buses and/or HGVs
- ➢ New roads constructed or proposed since first round of review and assessment
- ➢ Roads close to the objective during the first round of review and assessment
- ➢ Roads with significantly changed traffic flows
- ➢ New industrial sources
- ➢ Industrial sources with substantially increased emissions
- ➢ Areas with domestic solid fuel burning
- ➢ Quarries, landfill sites, opencast coal, handling of dusty cargoes at ports etc
- ➢ Aircraft
These are evaluated in the following sections.
10.5 BACKGROUND CONCENTRATIONS FOR PM10
The estimated average background PM10 concentration for 2001 was 18.1 μg/m3 on the Isle of Wight with maximum concentration of 19.7 μg/m3 .
10.6 SCREENING ASSESSMENT OF MONITORING DATA
No monitoring of PM10 is undertaken on the Isle of Wight.
10.7 SCREENING ASSESSMENT OF ROAD TRAFFIC SOURCES
PM10 concentrations from road traffic were estimated using the DMRB model.
Tables 10.2 shows PM10 concentrations for 2004 calculated using traffic count data taken from the NAEI A traffic growth factor of 1.08 from 2000 to 2004, was used which was calculated from TEMPRO database.
Road | East | North | Distance receptor to road centre m | AADT 2004 | Average Speed kph | % HDV | PM10 | No of exceedences of daily mean |
|---|
| A3020 | 450000 | 89500 | 5 | 26947 | 60 | 4.4 | 22.4 | 7 |
| A3020 | 455000 | 81700 | 5 | 7376 | 60 | 4.2 | 20.2 | 4 |
| A3020 | 449600 | 95000 | 5 | 5884 | 60 | 3.2 | 19.8 | 3 |
| A3020 | 450600 | 86900 | 5 | 19257 | 60 | 5.6 | 22.3 | 7 |
| A3020 | 450300 | 89000 | 5 | 14682 | 60 | 4.7 | 21.7 | 6 |
| A3021 | 451060 | 95000 | 5 | 8581 | 60 | 4.5 | 20.5 | 4 |
| A3021 | 452000 | 92461 | 5 | 13378 | 60 | 4.9 | 21.5 | 5 |
| A3021 | 450400 | 95590 | 5 | 2160 | 60 | 4.0 | 19.2 | 2 |
| A3021 | 450200 | 95550 | 5 | 8640 | 60 | 4.0 | 20.4 | 4 |
| A3021 | 450250 | 95640 | 5 | 6480 | 60 | 4.0 | 20.0 | 3 |
| A3021 | 451919 | 91906 | 5 | 3255 | 60 | 4.9 | 19.5 | 3 |
| A3054 | 440000 | 89160 | 5 | 6153 | 60 | 5.5 | 20.1 | 4 |
| A3054 | 459201 | 92640 | 5 | 7579 | 60 | 4.6 | 20.3 | 4 |
| A3054 | 433400 | 88000 | 5 | 2930 | 60 | 6.1 | 19.4 | 3 |
| A3054 | 452000 | 91724 | 5 | 19472 | 60 | 2.9 | 21.6 | 6 |
| A3054 | 455000 | 92060 | 5 | 18298 | 60 | 4.6 | 22.0 | 6 |
| A3054 | 456000 | 92330 | 5 | 17477 | 60 | 4.2 | 21.8 | 6 |
| A3054 | 458930 | 92540 | 5 | 7082 | 60 | 3.7 | 20.1 | 3 |
| A3054 | 459100 | 92520 | 5 | 7082 | 60 | 3.7 | 20.1 | 3 |
| A3054 | 452239 | 92036 | 5 | 10902 | 60 | 6.5 | 21.3 | 5 |
| A3054 | 450800 | 90400 | 5 | 19483 | 60 | 4.3 | 22.0 | 6 |
| A3055 | 450000 | 76250 | 5 | 1895 | 60 | 3.5 | 19.1 | 2 |
| A3055 | 458500 | 82000 | 5 | 7429 | 60 | 4.0 | 20.2 | 4 |
| A3055 | 459950 | 92710 | 5 | 7781 | 60 | 3.4 | 20.2 | 4 |
| A3055 | 459260 | 92580 | 5 | 6872 | 60 | 5.4 | 20.2 | 4 |
| A3055 | 456400 | 77600 | 5 | 1620 | 60 | 3.9 | 19.1 | 2 |
| A3055 | 456400 | 77510 | 5 | 1620 | 60 | 3.9 | 19.1 | 2 |
| A3055 | 457470 | 80000 | 5 | 2160 | 60 | 4.8 | 19.2 | 3 |
| A3056 | 455000 | 84240 | 5 | 14059 | 60 | 4.8 | 21.6 | 6 |
| A3201 | 450350 | 95550 | 5 | 6480 | 60 | 4.0 | 20.0 | 3 |
Table 10.2 Estimated PM10 concentrations in 2004 near roads on the Isle of Wight
The DMRB screening run indicates that the 2004 annual mean objective for PM10 of 40 μg/m3 and the 24-hour mean objective of 50 μg/m3 (not to be exceeded more than 35 times per year) are not likely to be exceeded at receptors near A roads on the Isle of Wight.
| | | Distance receptor to road centre m | AADT 2004 | Average Speed kph | % HDV | PM10 | No of exceedences of daily mean |
| Ryde | St Johns Hill | 14 | 13741 | 48 | 6 | 21.5 | 5 |
| Newport | Fairlee Road | 12.8 | 13466 | 48 | 6 | 21.5 | 6 |
| Newport | Fairlee Road | 12.8 | 25060 | 48 | 6 | 22.5 | 7 |
| Newport | Horsebridge Hill | 10.5 | 29565 | 48 | 6 | 23.0 | 8 |
| Newport | Forest Road | 12 | 14090 | 48 | 6 | 21.7 | 6 |
| Sandown | Broadway | 6 | 14874 | 48 | 6 | 22.3 | 7 |
| East Cowes | Whippingham Road | 6.6 | 19865 | 48 | 6 | 22.8 | 8 |
| Newport | Medina Way | 25 | 37265 | 48 | 6 | 21.9 | 6 |
| Shanklin | Sandown Road | 10.7 | 23822 | 48 | 6 | 22.7 | 7 |
| Lake | Newport Road | 9.6 | 17528 | 48 | 6 | 22.3 | 7 |
| Newport | Forest Road | 12 | 15719 | 48 | 6 | 22.0 | 6 |
| Wootton | High Street | 11 | 22072 | 48 | 6 | 22.5 | 6 |
| Lake | Lake Hill | 9.8 | 26136 | 48 | 6 | 22.9 | 8 |
10.7.1 Narrow congested streets with residential properties close to the kerb
There are no roads on the Isle of Wight meeting this description.
10.7.2 Busy Junctions
There are no junctions on the Isle of Wight with flows of more than 10000 vehicles per day and relevant receptors within 10m.
10.7.3 Busy streets where people may spend 1-hour or more close to traffic
There are no roads on the Isle of Wight meeting this description.
10.8 SCREENING ASSESSMENT OF INDUSTRIAL SOURCES
There are no new industrial sources or existing industrial sources with significantly increased emissions since the last review.
10.9 SCREENING ASSESSMENT OF FUGITIVE AND UNCONTROLLED SOURCES
10.9.1 Quarries and landfill sites
There are 10 areas of quarrying activity on the Isle of Wight. These quarries were assessed in the Stage 2 Review and there has been no change since then.
10.9.2 Domestic solid fuel burning
According to the Isle of Wight Council there are no areas of the Isle of Wight where domestic coal burning is a source of PM10.
10.10 SCREENING ASSESSMENT OF OTHER TRANSPORT SOURCES
10.10.1 Airports
There are no airports with a throughput of 5 million passengers per year on or near the Isle of Wight.
10.11 CONCLUSIONS FOR PM10 CONCENTRATIONS IN THE ISLE OF WIGHT
The DMRB screening model indicates that the annual mean objective of 40 μg/m3 for PM10 will be met in 2004. The 24 hour mean objective of 50 μg/m3 is unlikely be exceeded more than 35 times a year in 2004 near roads on the Isle of Wight.
11 Conclusions
11.1 CARBON MONOXIDE
There are no roads on the Isle of Wight which can be classified as ‘very busy’ with receptors within 20m.
The Isle of Wight Council is not required to carry out a Detailed Assessment for carbon monoxide.
11.2 BENZENE
There are no roads on the Isle of Wight which can be classified as ‘very busy’ with receptors within 20m. There are no petrol stations with a throughput greater than 2 million litres and with relevant exposure within 10m of the pumps. The only major fuel storage depot on the Isle of Wight is the BP Oils depot in East Cowes which has a throughput of 50 million litres of petrol per annum. There are relevant receptors within 40m of the depot. According the nomograms in LAQM (TG(03) there may be a risk of exceeding the 2010 annual mean objective of 5 μg/m3.
The Isle of Wight Council is required to carry out a Detailed Assessment for benzene.
The Isle of Wight Council is required to carry out a Detailed Assessment for benzene.
11.3 1,3-BUTADIENE
Estimated background concentrations and data from national monitoring stations indicate that the objective for 1,3-butadiene is likely to be achieved by the end of 2003. There are no industrial processes, current or proposed, on the Isle of Wight which have the potential to emit 1,3-butadiene.
The Isle of Wight Council is not required to carry out a Detailed Assessment for 1,3-butadiene.
11.4 LEAD
Emissions of lead from industrial processes on the Isle of Wight are not likely to exceed the objectives for lead to be achieved in 2004 and 2008.
The Isle of Wight Council is not required to carry out a Detailed Assessment for lead.
11.5 NITROGEN DIOXIDE
The DMRB screening model indicates that the 2005 annual mean objective for NO2 is unlikely be exceeded at receptors near roads on the Isle of Wight.
The Isle of Wight Council is not required to carry out a Detailed Assessment for nitrogen dioxide.
11.6 SULPHUR DIOXIDE
There are no significant industrial or domestic sources of sulphur dioxide on the Isle of Wight.
There are a more than 5,000 car ferry movements per year in each of the three main ports on the Isle of Wight. The Isle of Wight Council is recommended to carry out a Detailed Assessment for sulphur dioxide based on car ferry emissions at the ports of Fishbourne, Cowes and Yarmouth.
There are a more than 5,000 car ferry movements per year in each of the three main ports on the Isle of Wight. The Isle of Wight Council is recommended to carry out a Detailed Assessment for sulphur dioxide based on car ferry emissions at the ports of Fishbourne, Cowes and Yarmouth.
11.7 PM10
The DMRB screening model indicates that the annual mean objective of 40 μg/m3 for PM10 will be met in 2004. The 24 hour mean objective of 50 μg/m3 is unlikely be exceeded more than 35 times a year in 2004 at locations near roads on the Isle of Wight.
The Isle of Wight Council is not required to carry out a Detailed Assessment for PM10.
12 References
1. DETR (2000b) The Air Quality Strategy for England, Scotland, Wales and Northern Ireland. Department of the Environment, Transport and the Regions. Cm 4548, SE 2000/3, NIA 7.
2 The Air Quality (England) Regulations 2000 39 Statutory Instrument No. 298 March 2000
The Air Quality Amendment Regulations 2002, ISBN 0 11061468 2.
3. Part IV of the Environment Act 1995. Local Air Quality Management. LAQM.TG(03) January 2003.
4. First Stage Air Quality Review & Assessment.
Isle of Wight Council, April 2000.
5. Isle of Wight Council (2002) Second Stage Air Quality Review & Assessment.
netcen, June 2000
8. EA (1998b) Guidance for estimating the air quality impact of stationary sources. Guidance Note 24. Environment Agency
13 Acknowledgements
We are grateful for the help of William Berry of the Isle of Wight Council in the preparation of this report.
| Appendices |
| |
CONTENTS
| Appendix 1 | Traffic Data |
| Appendix 2 | Detailed monitoring data |
| Appendix 3 | Authorised Processes |
| Appendix 4 | Descriptions of DMRB Model |
| Appendix 1 Road Traffic Data |
| |
CONTENTS
| Table A1.1 | Traffic Data supplied by IOW Council |
| | |
| | |
| | |
| | |
| | |
| | |
| | |
| | |
| | |
Table A1.1 Traffic Data supplied by IOW Council
| Town | Road | Date | Flows | Average | AADT |
| Godshill | Newport Road | 05/08/2002 | 2 | 4528 | 9056 |
| Ryde | Ashey Downs Road | 08/09/2003 | 2 | 4603 | 9206 |
| Newport | Blackwater Road | 30/06/2003 | 1 | 4942 | 9884 |
| Ryde | Green Street | 01/10/2001 | 2 | 4960 | 9920 |
| Newport | Fairlee Road | 09/07/2001 | 1 | 5870 | 11740 |
| Ryde | St Johns Hill | 18/05/2001 | 2 | 5990 | 11980 |
| Newport | Forest Road | 20/08/2001 | 2 | 6142 | 12284 |
| Sandown | Broadway | 01/04/2002 | 2 | 6518 | 13036 |
| Whippingam | Main Road | 31/05/2003 | 2 | 6932 | 13864 |
| Newport | Forest Road | 23/06/2003 | 2 | 6943 | 13886 |
| Brading | Brading Road | 19/08/2002 | 2 | 7220 | 14440 |
| Newport | Carisbrooke Road | 29/07/2003 | 2 | 7223 | 14446 |
| Lake | Newport Road | 12/05/2003 | 2 | 7742 | 15484 |
| Ryde | Quarr Hill | 14/07/2003 | 2 | 7995 | 15990 |
| East Cowes | Whippingham Road | 05/08/2002 | 2 | 8705 | 17410 |
| Ryde | Binstead Hill | 09/06/2003 | 1 | 9710 | 19420 |
| Wootton | High Street | 30/06/2003 | 1 | 9749 | 19498 |
| Wootton | Eleanors Grove | 20/08/2001 | 2 | 9838 | 19676 |
| Shanklin | Sandown Road | 02/12/2002 | 2 | 10439 | 20878 |
| Newport | Blackwater Road | 11/08/2003 | 2 | 10568 | 21136 |
| Newport | Fairlee Road | 06/08/2001 | 2 | 10924 | 21848 |
| Newport | Cross Lane | 21/05/2001 | 1 | 11450 | 22900 |
| Lake | Lake Hill | 28/07/2003 | 2 | 11544 | 23088 |
| Newport | Horsebridge Hill | 06/08/2001 | 2 | 12888 | 25776 |
| Newport | Medina Way | 05/08/2002 | 2 | 16330 | 32660 |
| Appendix 2 Diffusion Tube Data |
| |
CONTENTS
| Table A2.1 | Monitoring Locations |
| Table A2.2 | Diffusion Tube Results |
| | |
| | |
| | |
| | |
| | |
| | |
| | |
| | |
Table A2.1 Monitoring Locations
| | Name | Type | East | North |
| IW4 | Sandown High School | B | 458600 | 84600 |
| IW5 | Ryde High School | B | 458300 | 91800 |
| IW1 | Carisbrooke Castle | B | 448400 | 88800 |
| IW2 | Cowes High School | B | 449100 | 94800 |
| IW3 | Medina High School | K | 450800 | 90400 |
| IW6 | Newpoert Road Cowes | K | 449200 | 91500 |
| IW7 | Fairlee Road Newport | K | 450400 | 98500 |
| IW8 | Blackwater Service Station | K | 450700 | 86500 |
| IW9 | lake Hill Sandown | K | 459200 | 83700 |
Table A2.2 Diffusion Tube Results 2002
| | | | | | 2002 | | | | | | | | |
| | Jan | Feb | Mar | Apr | May | Jun | Jul | Aug | Sep* | Oct | Nov | Dec | Mean |
| IW1 | 13.6 | 8.9 | 8.7 | 1.7 | 7.8 | 3.4 | 5.0 | 6.6 | 46.2 | 7.6 | 13.8 | 21.0 | 8.9 |
| IW2 | 13.6 | 8.9 | 9.6 | 6.1 | 7.0 | 4.3 | 7.4 | 9.7 | 57.5 | 8.4 | 17.3 | 22.7 | 10.5 |
| IW3 | 22.5 | 15.1 | 21.5 | 12.3 | | 12.2 | 17.0 | 16.1 | 80.8 | 14.9 | 27.1 | 28.8 | 18.7 |
| IW4 | 38.6 | 27.3 | 31.1 | 24.5 | | 20.8 | 19.4 | | | 18.3 | 37.7 | 37.6 | 28.4 |
| IW5 | 17.8 | 11.2 | 17.8 | 5.0 | 14.8 | 12.9 | 13.1 | 8.0 | 52.5 | 8.2 | 17.3 | 21.6 | 13.4 |
| IW6 | | 6.1 | | | 9.6 | 6.7 | 6.0 | 6.4 | 63.8 | | 23.5 | 22.7 | 11.6 |
| IW7 | 10.1 | 5.6 | 8.2 | 2.8 | 4.4 | 4.3 | 4.3 | 5.1 | 86.1 | 6.5 | 11.5 | 19.4 | 7.5 |
| IW8 | 30.9 | 29.5 | 41.1 | 34.0 | 17.4 | 20.2 | 20.2 | 18.8 | 36.3 | 28.5 | 44.4 | 33.8 | 29.0 |
| IW9 | 13.7 | 12.3 | 11.9 | 7.8 | 3.0 | 12.9 | 12.9 | 9.8 | 28.1 | 17.2 | 12.9 | 23.3 | 12.5 |
* Results for September 2002 have been excluded from the mean calualtion because they appear anomolously high
| Appendix 3 Authorised Processes |
| |
CONTENTS
| Table A3.1 | Part A Processes |
| | |
| | |
| | |
| | |
| | |
| | |
| | |
| | |
| | |
| Operator Name | Authorisation No. | Site Address | Process Type |
| INNOGY PLC | AF7169 | COWES GT POWER STATION KINGSTON ROAD EAST COWES ISLE OF WIGHT PO32 6JF | combustion processes |
| CONTRACT HEAT AND POWER LTD | AF8092 | FOREST PARK FOREST ROAD NEWPORT ISLE OF WIGHT PO30 5YS | combustion processes |
| GKN WESTLAND AEROSPACE (HOLDINGS) LTD | AO0504 | MARESFIELD WORKS MARESFIELD ROAD EAST COWES ISLE OF WIGHT PO32 6AF | inorganic chemical processes |
| ISLAND WASTE SERVICES LIMITED | ISL012/10203 | BRIDDLESFORD ROAD DOWNEND NEWPORT | landfill sites and waste transfer stations |
| Appendix 4 Descriptions of DMRB model |
| |
CONTENTS
| | |
| 1 | Design Manual for Roads and Bridges (DMRB)7 |
| | |
| | |
| | |
| | |
| | |
| | |
| | |
| | |
Design Manual for Roads and Bridges (DMRB)7 - This screening method was formulated by the former Department of Transport. The method gives a preliminary indication of air quality near roads, and is more suited to rural motorways and trunk roads than city centre traffic conditions. It is a simple procedure based on tables and nomograms; originally published in August 1994, a revision has been produced in 1999, which is more applicable to urban road situations. The DMRB method requires information on vehicle flow, HGV mix, vehicle speed and receptor-road distances. It contains a useful database of vehicular emission factors for future years.
In the revision of the DMRB method the following pollutants can be estimated:
- the maximum 8-hour mean CO concentration;
- the 98th percentile and the maximum of hourly mean NO2 concentrations;
- the annual average benzene and annual average 1,3 butadiene concentration;
- the annual mean and the fourth highest daily mean PM10 concentrations.
The method adopts the annual mean concentration as the base statistic. Background pollutant levels are included explicitly in the calculations by adding an amount to the annual mean traffic contribution using the Air Quality Archive (paragraph 6.09) or default values. Surrogate statistics are used to convert annual means to National Air Quality Strategy statistics. Details of the road layout cannot be specified.
[1] Refers to standards recommended by the Expert Panel on Air Quality Standards. Recommended standards are set purely with regard to scientific and medical evidence on the effects of the particular pollutants on health, at levels at which risks to public health, including vulnerable groups, are very small or regarded as negligible.
Page last updated on: 18/12/2009