


2009 Air Quality Updating and Screening Assessment for
Isle of Wight Council
In fulfillment of Part IV of the Environment Act 1995
Local Air Quality Management
A report produced for Isle of Wight Council
June, 2009
| Local Authority Officer | Mr William Berry Senior Environmental Health Practitioner |
| Department | Community Safety Services |
| Address | Isle of Wight Council Jubilee Stores The Quay Newport Isle of Wight PO30 2EH |
| Telephone | (01983) 823000 | Fax: (01983) 823158 | |
| e-mail | william.berry@iow.gov.uk |
| Report Reference number | |
| Date | June 2009 |


Report Prepared by: .......................................... Approved by: ....................................
James Rawlinson Sam Pollard
Senior Environmental Scientist Principal Environmental Scientist
Faber Maunsell Faber Maunsell
East Dorset USA 2009
| Rev No | Comments | Date |
| 1 | Final version | June 2009 |
| | | |
Telephone: Fax: Website: http://www.fabermaunsell.com
Job No 60097704 Reference JAR Date Created June 2009
This document has been prepared by Faber Maunsell Limited (“Faber Maunsell”) for the sole use of our client (Isle of Wight Council Council) and in accordance with generally accepted consultancy principles, the budget for fees and the terms of reference agreed between Faber Maunsell and the Client. Any information provided by third parties and referred to herein has not been checked or verified by Faber Maunsell, unless otherwise expressly stated in the document.
No third party may rely upon this document without the prior and express written agreement of Faber Maunsell.
Executive Summary
An assessment of the current air quality situation within the administrative area of Isle of Wight Council Council has been undertaken in line with the Defra LAQM Technical Guidance TG (09). The report has assessed all available air quality monitoring data from the Island against the air quality objectives as well as any significant changes on the Island since the last round of review and assessment that could impact on local air quality. These can include changes to the local road network, new industrial installations or new local development which would result in increased human exposure to the pollutants listed in the Air Quality Strategy 2007.
Assessment of the 2008 air quality monitoring data set showed there to be one site showing an exceedence of the nitrogen dioxide (NO2) annual mean objective. Further analysis of the site with the appropriate facade calculations, identified that both the annual mean and 1 hour air quality objectives for nitrogen dioxide were unlikely to be exceeded. No other likely exceedences of the air quality objectives where identified.
Five new industrial processes with Part B (LAPPC) authorisations have been identified as new since the Updating and Screening Assessment (USA) 2006. These are two mobile crushing processes and three waste oil burners. The road junction of Medina Way and Forest Road was also identified as requiring assessment.
The report considers these installations unlikely to lead to significant increases in any pollutant prescribed in the Air Quality Strategy 2007. No exceedences were predicted at the junction of Medina Way and Forest Road.
The overall results of this USA indicate that a Detailed Assessment is therefore not required for any pollutant.
Table of contents
Appendices
Appendix B: DMRB Calculations
Appendix C: Traffic Data
Appendix D: Diffusion Tube Results Close to the Annual Mean Objective
Appendix E: Monthly Nitrogen Dioxide Concentrations 2008
Appendix F: LAPPC Authorised Processes
1 Introduction
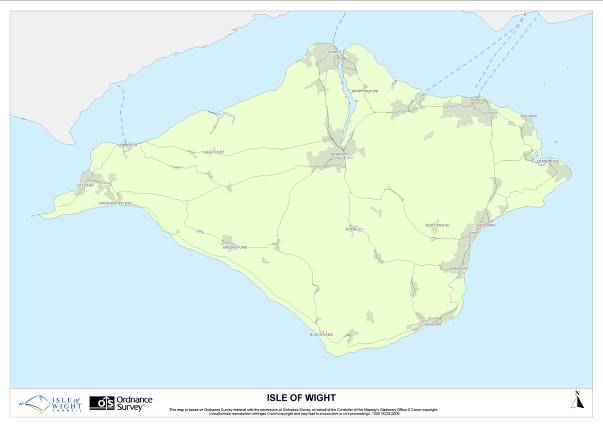
1.1 Description of Local Authority Area
The Isle of Wight is situated approximately 5 km off the coast of the cities of Southampton and Portsmouth. The main urban areas on the Island include Cowes, Shanklin, Sandown, Ventnor, Ryde, Yarmouth and Newport. The main road links include the A3020, A3055, A3054 and the A3021. The primary source of local emissions of the pollutants listed in the Air Quality
Strategy are road traffic and shipping with no other significant sources.
Figure 1: Isle of Wight
Strategy are road traffic and shipping with no other significant sources.
Figure 1: Isle of Wight
1.2 Purpose of Report
This report fulfils the requirements of the Local Air Quality Management process as set out in Part IV of the Environment Act (1995), the Air Quality Strategy for England, Scotland, Wales and Northern Ireland 2007 and the relevant Policy and Technical Guidance documents. The LAQM process places an obligation on all local authorities to regularly review and assess air quality in their areas, and to determine whether or not the air quality objectives are likely to be achieved. Where exceedences are considered likely, the local authority must then declare an Air Quality Management Area (AQMA) and prepare an Air Quality Action Plan (AQAP) setting out the measures it intends to put in place in pursuit of the objectives.
1.3 Air Quality Objectives
The air quality objectives applicable to LAQM in England are set out in the Air Quality (England) Regulations 2000 (SI 928), The Air Quality (England) (Amendment) Regulations 2002 (SI 3043), and are shown in Table 1.1. This table shows the objectives in units of microgrammes per cubic metre μg/m3 (milligrammes per cubic metre, mg/m3 for carbon monoxide) with the number of exceedences in each year that are permitted (where applicable).
Table 1.1 Air Quality Objectives included in Regulations for the purpose of Local Air Quality Management in England.
| Pollutant | Air Quality Objective | Date to be achieved by | |
| Concentration | Measured as | ||
| Benzene | 16.25 µg/m3 | Running annual mean | 31.12.2003 |
| | 5.00 µg/m3 | Running annual mean | 31.12.2010 |
| 1,3-Butadiene | 2.25 µg/m3 | Running annual mean | 31.12.2003 |
| Carbon monoxide | 10.0 mg/m3 | Running 8-hour mean | 31.12.2003 |
| Lead | 0.5 µg/m3 0.25 µg/m3 | Annual mean Annual mean | 31.12.2004 31.12.2008 |
| Nitrogen dioxide | 200 µg/m3 not to be exceeded more than 18 times a year 40 µg/m3 | 1-hour mean Annual mean | 31.12.2005 31.12.2005 |
| Particles (PM10) (gravimetric) | 50 µg/m3, not to be exceeded more than 35 times a year 40 µg/m3 | 24-hour mean Annual mean | 31.12.2004 31.12.2004 |
| Sulphur dioxide | 350 µg/m3, not to be exceeded more than 24 times a year 125 µg/m3, not to be exceeded more than 3 times a year 266 µg/m3, not to be exceeded more than 35 times a year | 1-hour mean 24-hour mean 15-minute mean | 31.12.2004 31.12.2004 31.12.2005 |
1.4 Summary of Previous Review and Assessments
1.4.1 First Round of Review and Assessment
Unlike the current format of the Updating and Screening Assessment, Detailed Assessment and Further Assessment, round one of the Review and Assessment process was split into four staged reports, with each being more detailed than the last. The Isle of Wight Council completed its first round of Review and Assessment in 2000 and concluded it was likely that all air quality objectives would be met.
1.4.2 Second Round of Review and Assessment
The 2004 Updating and Screening Assessment, concluded that the Council needed to move to a Detailed Assessment for both benzene and sulphur dioxide.
Possible exceedences of the benzene annual mean objective were identified at receptors adjacent to a fuel storage depot in East Cowes, which had a throughput of 50 million litres of petrol per annum. Possible exceedences of the sulphur dioxide were identified at receptors near to the three main ferry ports, as there were more than 5,000 car ferry movements per year.
The subsequent Detailed Assessment concluded that the sulphur dioxide 15-minute mean objective will not be exceeded in East Cowes, Fishbourne and Yarmouth in 2004/2005. The highest predicted 15 minute concentration (89 μg/m3 in East Cowes) was well below the objective. Predicted concentrations in Fishbourne were lower than those predicted to occur in East Cowes, with concentrations in Yarmouth lower still.
The annual mean benzene concentrations predicted to occur in East Cowes in 2004 and 2010 were also well below both the 2003 and 2010 air quality objectives.
In line with the relevant Defra guidance the council was therefore required to produce an Air Quality Progress Report in April 2004 and April 2005. Progress Reports are required in years when local authorities are not carrying out their statutory three yearly Updating and Screening Assessment or carrying out Detailed Assessments. This ensures that air quality is continually being assessed and reviewed.
The 2004 and 2005 Progress Reports concluded that there had been no changes since the previous USA significant enough to result in exceedences of the air quality objectives.
1.4.3 Third Round of Review and Assessment
The results of the 2006 USA indicated that a Detailed Assessment for NO2 was required, due to identified exceedences of the annual mean objective at two monitoring sites in the area over the previous three years. The exceedences were considered to be as a result of road traffic emissions.
The Council then conducted NO2 diffusion tube analysis at these two locations as part of its Detailed Assessment. The results concluded that there was no need at this stage to declare an Air Quality Management Area.
The Council then conducted NO2 diffusion tube analysis at these two locations as part of its Detailed Assessment. The results concluded that there was no need at this stage to declare an Air Quality Management Area.
2 New Monitoring Data
2.1 Summary of Monitoring Undertaken
2.1.1 Automatic Monitoring Sites
There are no automatic air quality monitoring sites on the Island.
2.1.2 Non-Automatic Monitoring
The Council currently operates three NO2 diffusion tube sites on the Island (IOW 4, 11 and 10). These locations are show in Figures 2 and 3, with site details given in Table 2.2. Site IOW 8 was discontinued in 2007.
Figure 2: NO2 Tube Locations- Fairlee Road
Note: the OS licence number for the maps used in Figures 2, 3 and B 1 is 100019229.
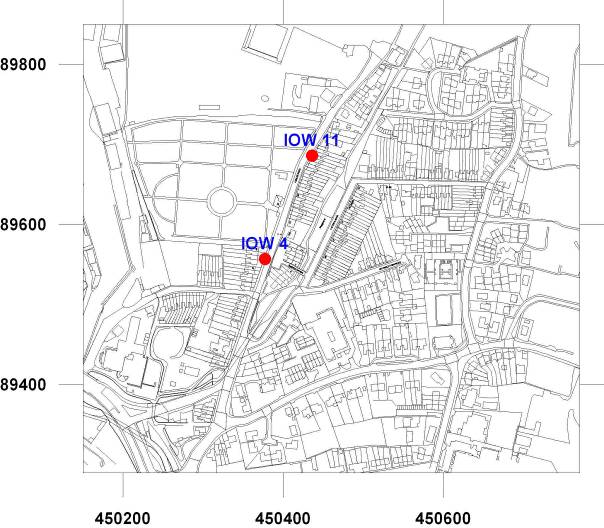
Figure 3: NO2 Tube Locations- Lake Hill
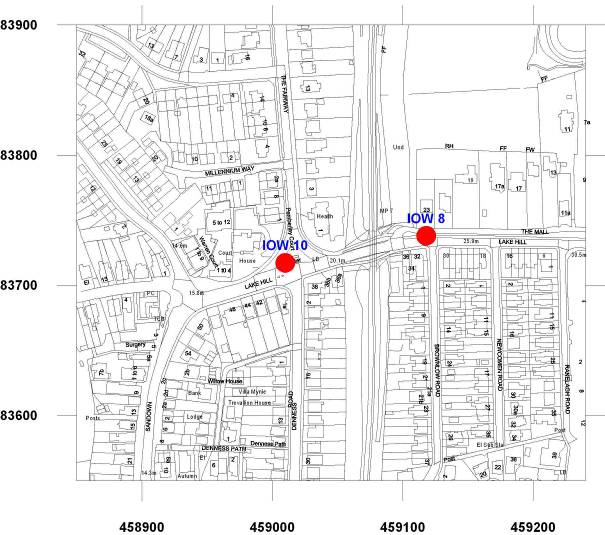
Table 2.2 Details of Non- Automatic Monitoring Sites
| Site ID | Site Type | OS Grid Ref | Pollutants Monitored | In AQMA? | Relevant Exposure? (Y/N with distance (m) to relevant exposure) | Distance to kerb of nearest road (N/A if not applicable) | Worst-case Location? |
| IOW4 | kerbside | 450377 089557 | NO2 | N/A | N (11) | 0 | Y (kerbside) |
| IOW8 | kerbside | 459118 083738 | NO2 | N/A | N (19 m) | 0 | Y (kerbside) |
| IOW10 | kerbside | 459101 083717 | NO2 | N/A | N (23 m) | 2 | Y (kerbside) |
| IOW11 | roadside | 450436 089686 | NO2 | N/A | Y | 11 | Y (Facade) |
2.2 Comparison of Monitoring Results with AQ Objectives
In order to assess the measured concentrations against the annual mean nitrogen dioxide air quality objective, both the tubes and the data need to be subject to quality assurance/quality control protocols. These allow for inherent uncertainty in the measured concentrations to be minimised.
All details of the QA/QC procedures that have been applied to the diffusion tube monitoring are given in Appendix A.
The overall purpose of the USA is to identify any possible exceedences of the Air Quality Objectives that are therefore required to be considered as part of a Detailed Assessment. In doing so it is vital to consider not only the measured concentrations against the objectives but also relevant exposure. In cases where monitoring locations do not represent exposure, the façade distance calculation method as described in LAQM.TG (09), has been used. This has been clearly stated in the report.
2.2.1 Nitrogen Dioxide
The two air quality objectives that ambient concentrations of NO2 need to be assessed against are as follows:
- An annual mean of 40 µg/m3; and
- The number of exceedences of the 1 hour mean of 200 µg/m3 (18 allowable exceedences in total).
It should be noted that it is only possible to directly assess against the 1 hour objective if hourly monitoring data is available. As all local monitoring on the Island is conducted with diffusion tubes the approach suggested in LAQM. TG(09) has been adopted. The approach, based on empirical studies suggests that where the annual mean is less than 60 µg/m3, exceedences of the short term objective are unlikely.
Automatic Monitoring Data
There are no automatic air quality monitoring sites on the Island.
Diffusion Tube Monitoring Data
Up to the end of 2004, the Council had been monitoring NO2 using passive diffusion tubes at 9 locations on the Island. At the end of 2004, 7 of the 9 sites where discontinued due to consistently showing annual means well below the air quality objective. During 2005 monitoring only took place at Sites IOW4 and IOW8 (see Table 2.2) with Site 8 being discontinued at the end of 2006, due to its kerbside location not being representative of relevant exposure. Monitoring continues in this area (Lake Hill) via Site 10.
From the beginning of 2006, Site 10 was set up in triplicate, with Site 11 also being set up in triplicate from the beginning of 2008, to monitor at Lake Hill, Sandown and Fairlee Road, Newport respectively. Despite historic monitoring taking place on Fairlee Road at Site 4, Site 11 was set up to better represent relevant exposure at that location.
The 2008 results for the three current monitoring locations including data capture percentage, are given in Table 2.4a. The full bias adjusted data set for all sites from 2006 are given in Table 2.4b.
Table 2.4a Results of Nitrogen Dioxide Diffusion Tubes (2008)
| Site ID | Location | Type | Within AQMA? | Data Capture 2008 % | Annual mean concentrations |
| 2008 (μg/m3) Adjusted for bias | |||||
| IOW4 | On lamppost outside 51 Fairlee Road | Kerbside | N | 62 | 42.8** |
| IOW8 | Kerb outside 23 Lake Hill | Kerbside | N | 100 | discontinued |
| IOW10* | Pedestrian refuge at junction of the Fairway and Lake Hill | Kerbside | N | 92 | 24.1 |
| IOW11* | On facade of 48 Fairlee Road | Roadside | N | 58 | 31.1** |
Note bias adjustment factors are provided in Appendix A
*triplicate results
** results below 90% data capture have been period adjusted (Appendix A)
** results below 90% data capture have been period adjusted (Appendix A)
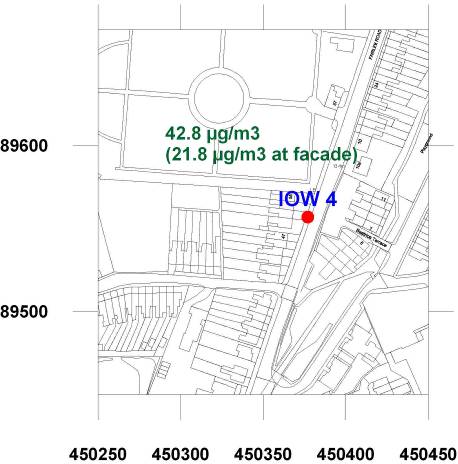
The results in the table show that of the three sites only Site IOW 4 measured an annual mean above the NO2 objective, with an annual mean concentration 42.8 µg/m3.
In terms of relevant exposure, Site IOW 4 is a kerbside location outside 51 Fairlee Road, Newport. The nearest relevant exposure is set back approximately 11m from this location, and will therefore experience lower concentrations than that measured by the tube. To demonstrate this a façade correction, (as set out in LAQM. TG(09)) has been applied. Using a background NO2 concentration of 12.5 µg/m3, the correction method shows the facade concentration to be 21.8 µg/m3 , which is significantly below and annual mean objective.
The second diffusion tube location on Fairlee Road, Site IOW11 on the facade of number 48, shows an annual mean of 31.1 µg/m3 for 2008. Taking into account that Site IOW 11 is approximately 10 m closer to the road than the façade location calculated for Site 4, the Council is confident that the facade result for Site IOW 4 is representative of actual concentrations at this location.
Table 2.4b Results of Nitrogen Dioxide Diffusion Tubes (2006-2008)
| Site ID | Location | Type | Within AQMA? | Annual mean concentrations (μg/m3) Adjusted for bias | ||
| 2006 | 2007 | 2008 | ||||
| IOW4 | On lamppost outside 51 Fairlee Road | kerbside | N | 38.3 | 41.0 | 42.8 |
| IOW8 | Kerb outside 23 Lake Hill | kerbside | N | 38.5 | * | * |
| IOW10 | Pedestrian refuge at junction of the Fairway and Lake Hill | kerbside | N | 25.0 | 24.6 | 24.1 |
| IOW11 | On facade of 48 Fairlee Road | roadside | N | * | * | 31.1 |
*site discontinued
The results in Table 2.4b show there to have been no exceedences at Site IOW 8, 10 and 11 in the last three years. Site IOW 4 has shown exceedences in years 2007 and 2008, however given the façade correction calculated for Site 4 for the 2008 data set, actual exceedences of the objective are considered unlikely.
Annual ratified data sets as shown in Table 2.4b are useful for assessing directly against the NO2 annual mean objective for that given year, but do not give any indication of concentration patterns over time. Figure 4 shows the annual results since 2000 for all sites. The results demonstrate a slightly erratic pattern in the first three years of monitoring, with some sites showing a general downward trend in measured annual mean concentrations and others showing an increase between the first and second years.
Ambient measurements increased at all sites in 2003 which was largely attributable to the metrological conditions experienced during that year[1]. The 2004 results show concentrations again dropping off. As previously stated a number of the sites were then discontinued due to measured concentrations being consistently below the NO2 annual mean air quality objective. Of the remaining sites and those subsequently set up only Site IOW 11 has shown an exceedence in the last two years. As previously discussed exceedences at locations of relevant exposure are considered unlikely.
Figure 4: Nitrogen Dioxide Annual Mean Concentrations 2000-2008
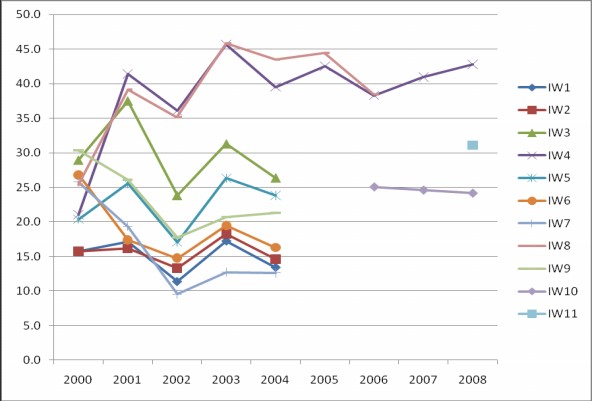
Assessment of the monitoring data shows no exceedences of either the annual mean or short term NO2 objective, there is therefore no requirement to move to a Detailed Assessment.
2.2.2 PM10
There are no PM10 monitoring sites on the Island.
2.2.3 Sulphur Dioxide
There are no sulphur dioxide monitoring sites on the Island.
2.2.4 Benzene
There are no benzene monitoring sites on the Island.
2.2.5 Other pollutants monitored
The Isle of Wight Council does not monitor for any other pollutant other than that previously stated.
3 Road Traffic Sources
Since the 2006 USA the Council has gathered a further two years traffic count data for a number of sites across the Island. The full data set is given in Appendix C. For the purpose of this report the data has been assessed in line with the new LAQM. (TG.09) Defra guidance. This includes taking account of the new assessment criteria (changes from the old LAQM. TG (03)), as well as any significant road traffic changes since the 2006 USA, that may impact on local air quality.
Assessment of all new traffic data only identified the Medina Way/Forest Road junction as requiring assessment (Section 3.4). All remaining sites for which traffic data has been collected and details as to why assessments are not required are given in Appendix C.
Assessment of all new traffic data only identified the Medina Way/Forest Road junction as requiring assessment (Section 3.4). All remaining sites for which traffic data has been collected and details as to why assessments are not required are given in Appendix C.
3.1 Narrow Congested Streets with Residential Properties Close to the Kerb
| Isle of Wight Council confirms that there are no new/newly identified congested streets with a flow above 5,000 vehicles per day and residential properties close to the kerb, that have not been adequately considered in previous rounds of Review and Assessment. |
3.2 Busy Streets Where People May Spend 1-hour or More Close to Traffic
| Isle of Wight Council confirms that there are no new/newly identified busy streets where people may spend 1 hour or more close to traffic. |
3.3 Roads with a High Flow of Buses and/or HGVs.
| Isle of Wight Council confirms that there are no new/newly identified roads with high flows of buses/HDVs. |
3.4 Junctions
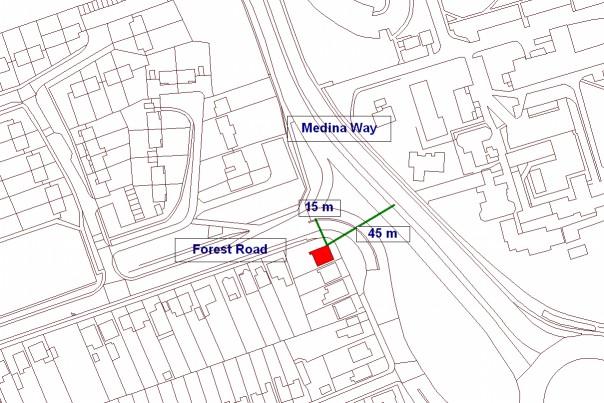
Assessment of traffic count data for 2008 identified the junction of Medina Way and Forest Road as requiring assessment for both NO2 and PM10.
Traffic count data for 2008 showed Annual Average Daily Traffic (AADT) flows for 32,087 and 8,480 for Medina Way and Forest Road respectively. This gives a total AADT flow at the junction of 40,567. TG (09) states that all junctions with flows in excess of 10,000 vehicles per day with receptors 10 m from the kerb (20 m in major conurbations) should be assessed. The nearest receptors in this case are 15 m from the kerb. However given that the AADT is far greater than 10,000 (40,567) and there is no local air quality monitoring, it was considered prudent to perform a DMRB screening assessment.
The nearest monitoring station to the assessment site is IOW6 (Newport Road) adjoining Medina Way to the north. However the site was discontinued at the end of 2004 as the annual mean results were consistently below the annual mean NO2 objective (Figure 4). Therefore as it is not possible to verify these results against the current local monitoring data a comparison with the older data set (2004) from Site IOW 6 has been made.
The annual average results of the assessment are given in Table 3.4 with all inputs show in Appendix B.
Table 3.4 DMRB screening model results for the Medina Way/Forest Road junction.
| Site | OS Grid Ref | Assessment Year | NO2 annual mean | PM10 annual mean |
| Medina Way/ Forest Road junction | 449384/90145 | 2008 | 22.3 | 19.0 |
3.4.1 Changes to the NOx to NO2 relationship.
The method to convert roadside NOx to NO2 within the DMRB model was based on measurements made between 1999 and 2001. Recent evidence shows that the proportion of primary NO2 in vehicle emissions has increased. This means that the relationship between NOx and NO2 at the roadside has changed from that currently used in the DMRB model.
To compensate for this the model has been run as normal with the NOx output then inputted into the new NOx/NO2 conversion tool as given on the review and assessment website. This road NO2 fraction was then added to the background to give the total modeled result as given in Table 3.4.
As previously stated it was not possible to verify the results as no current local monitoring data exists, therefore a comparison has been made with the 2004 annual mean from Site IOW 4, which was located on a lamppost on Horsebridge Hill (Medina Way turns in to Horsebridge Hill to the north of the DMRB assessment site). Although slightly lower traffic flows would be expected at the 2004 monitoring location the Medina Way/Forest Road junction, the IOW 4 site was significantly closer to the road than the modeled receptor in Table 3.4. Therefore the 2004 annual mean for the monitoring site of 26.4 µg/m3 compares well with the results given by the DMRB screening model.
Further to this and in line with national trends, it is likely that the ambient road side concentrations will have decreased since 2004, and would now be likely to show concentrations in the region of that given by the DMRB assessment.
As the DMRB assessment for NO2 and PM10 at this receptor shows annual mean concentrations well below the relevant objective a Detailed Assessment is not required.
| Isle of Wight Council has assessed new/newly identified junctions meeting the criteria in Section A.4 of Box 5.3 in TG(09), and concluded that it will not be necessary to proceed to a Detailed Assessment. |
3.5 New Roads Constructed or Proposed Since the Last Round of Review and Assessment
| Isle of Wight Council confirms that there are no new/proposed roads. |
3.6 Roads with Significantly Changed Traffic Flows
The updated data set in Appendix C shows that there have been two roads which have seen an increase of greater than 25% traffic volume since the 2006 USA. These are Rolls Hill, Thorness which has seen an increase of 38% since 2005 and Military Road, Freshwater, which has seen an increase of 57% since 2005.
Despite these increases both roads have AADT flows of < 3,000 and are therefore not required to be assessed any further.
Despite these increases both roads have AADT flows of < 3,000 and are therefore not required to be assessed any further.
| Isle of Wight Council has assessed new/newly identified roads with significantly changed traffic flows, and concluded that it will not be necessary to proceed to a Detailed Assessment. . |
3.7 Bus and Coach Stations
The only potentially significant bus station on the Island indentified for possible assessment was the Newport Bus Station. Data collected for this USA shows peak bus movements to be in the 80 per hour with less during the night time period. Taken as a worst case scenario of 80 per hour over the entire day, the total vehicle movements are shown to be 1950 vpd (80 x 24hrs). Therefore in line with the TG(09) criteria, despite there being relevant exposure within 10 m of the station, exceedences of either the 1 hour and annual mean objectives are unlikely.
Further to this, Southern Vectis (the main bus company) confirms that of the regular bus fleet, (excluding coaches and open tops), 30 meet the Euro 3 standard, 28 meet Euro 4, and 7 meet Euro 5. None are pre Euro.
| Isle of Wight Council has assessed new/newly identified bus stations, and concluded that it will not be necessary to proceed to a Detailed Assessment. |
4 Other Transport Sources
4.1 Airports
| Isle of Wight Council confirms that there are no airports in the Local Authority area. |
4.2 Railways (Diesel and Steam Trains)
4.2.1 Stationary Trains
| Isle of Wight Council confirms that there are no locations where diesel or steam trains are regularly stationary for periods of 15 minutes or more, with potential for relevant exposure within 15m. |
4.2.2 Moving Trains
| Isle of Wight Council confirms that there are no locations with a large number of movements of diesel locomotives, and potential long-term relevant exposure within 30m. |
4.3 Ports (Shipping)
Isle of Wight Council confirms that there are ports or shipping that meets the specified criteria within the Local Authority area. However, sulphur dioxide emissions from cross-solent car ferries were subject to a Detailed Assessment in 2004, which demonstrated that concentrations were well below the air quality objectives. As there have been no significant change to the fleet since then, no additional work is required.
5 Industrial Sources
5.1 Industrial Installations
The new Part B processes (authorised under LAPPC) identified since the 2006 USA, are two mobile crushers and three waste oil burners. (See 5.1.3).
5.1.1 New or Proposed Installations for which an Air Quality Assessment has been Carried Out
| Isle of Wight Council confirms that there are no new or proposed industrial installations for which planning approval has been granted within its area or nearby in a neighbouring authority. |
5.1.2 Existing Installations where Emissions have increased Substantially or New Relevant Exposure has been Introduced
| Isle of Wight Council confirms that there are no industrial installations with substantially increased emissions or new relevant exposure in their vicinity within its area or nearby in a neighbouring authority. |
5.1.3 New or Significantly Changed Installations with No Previous Air Quality Assessment
The new Part B processes (authorised under LAPPC) identified since the 2006 USA, are two mobile crushers and three waste oil burners.
The two mobile crusher processes are Cheverton Chalk and Gravel, Cheverton Shute, Shorwell, Newport and JPC Demolition, Pritchetts Way, Rookley. For the purpose of this screening assessment these can be considered as fugitive sources which can then be assessed against the emissions nomograms in TG (09). However there are number of complications and unquantifiable factors that make direct comparison with the guidance nomogram tools unworkable. These are as follows:
The two mobile crusher processes are Cheverton Chalk and Gravel, Cheverton Shute, Shorwell, Newport and JPC Demolition, Pritchetts Way, Rookley. For the purpose of this screening assessment these can be considered as fugitive sources which can then be assessed against the emissions nomograms in TG (09). However there are number of complications and unquantifiable factors that make direct comparison with the guidance nomogram tools unworkable. These are as follows:
- The mobile nature of the units. There are no clear identifiable locations for the equipments which can be used for the purpose of assessing relevant receptor locations.
- It is not possible with any degree of accuracy to isolate annual emissions from the use of the crushers.
- The erratic use of the crushers mean that there is no way of identifying through put of rock for the purpose of assessing PM10 and dust release.
With this in mind guidance was sought from the review and assessment help desk. The help desk confirmed that the use of crushers such as this has not previously been identified as an issue in LAQM and that it would be very difficult to identify specific emissions for the purpose of assessing against the TG (09) nomograms.
With this in mind the advice was to assess the history of dust complaints in order to judge the requirement to move on to a Detailed Assessment. To date the Council has not received any dust complaints relating to the use of mobile crushers at these two sites, therefore it has been concluded that PM10 exceedences are unlikely and that a Detailed Assessment is therefore not required. The Council will keep this under review and respond accordingly should complaints be received.
Assessment of the oil waste oil burners (the details of which are given in Appendix F) did not identify any receptors within 100 m meters of the emissions release point. This coupled with the small size of the units (approximately 0.03 MW input) and restricted winter usage, means that exceedences of the objectives are considered unlikely.
| Isle of Wight Council has assessed new/proposed industrial installations, and concluded that it will not be necessary to proceed to a Detailed Assessment. |
5.2 Major Fuel (Petrol) Storage Depots
A Detailed Assessment was carried out in 2004, examining SO2 concentrations arising from emissions from ferries in East Cowes, Fishbourne and Yarmouth ports, and benzene concentrations arising from emissions from a petrol storage depot in East Cowes.
The petrol storage depot was identified during the first round of review and assessment, as a new housing estate had been built adjacent to the site. Dispersion modelling for benzene supplemented with benzene diffusion tube monitoring for a short period (The results of which were reported in the 2005 Progress Report), identified that exceedences of the benzene objective were unlikely at the worse case receptors. There was therefore no need to declare an Air Quality Management Area for benzene.
As there have been no significant changes to the site in terms of either exposure or emissions since the 2004 Detailed Assessment, there is no need to reassess the depot again in this report.
| There are major fuel (petrol) storage depots within the Local Authority area, but these have been considered in previous reports. |
5.3 Petrol Stations
| Isle of Wight Council confirms that there are no petrol stations meeting the specified criteria. |
5.4 Poultry Farms
| Isle of Wight Council confirms that there are no poultry farms meeting the specified criteria. |
6 Commercial and Domestic Sources
6.1 Biomass Combustion – Individual Installations
Presently there are no biomass units on the Island. However a plant is currently going through Planning. Should this be given permission, details of the installation along with any identified air quality impacts, will be included in subsequent LAQM reports.
| Isle of Wight Council confirms that there is no biomass combustion plant in the Local Authority area. |
6.2 Biomass Combustion – Combined Impacts
6.3 Domestic Solid-Fuel Burning
| Isle of Wight Council confirms that there are no areas of significant domestic fuel use in the Local Authority area. |
7 Fugitive or Uncontrolled Sources
The only possible fugitive source identified in this assessment, are the mobile crushers discussed in 5.1.3.
| Isle of Wight Council has assessed potential sources of fugitive particulate matter, and concluded that it will not be necessary to proceed to a Detailed Assessment. |
8 Conclusions and Proposed Actions
8.1 Conclusions from New Monitoring Data
The Isle of Wight Council only monitors for the pollutant NO2 and only with diffusion tubes. From the monitoring and review and assessment reports to date no exceedences of any of the air quality objectives have been identified. Therefore the council has no AQMA at present.
The 2008 results show that of the three current sites only Site IOW 4 measured an annual mean above the NO2 objective, with an annual mean concentration 42.8 µg/m3. However subsequent façade calculations suggest that the annual mean at the nearest relevant receptor would be 21.8 µg/m3, well below the objective. This result was in agreement with the results from Site 11 (31.1 µg/m3) which is approximately 10 m closer to the road.
Therefore based on local monitoring data, a Detailed Assessment is not required for NO2.
The long term trends in Figure 4 (2000-2008) show a slightly erratic pattern in the first three years of monitoring with some sites showing a general downward trend in measured annual mean concentrations with others showing an increase between the first and second years.
Ambient measurements increased at all sites in 2003 which was largely attributable to the metrological conditions experienced in that year. The 2004 results show concentrations again dropping off. As previously stated a number of the sites were then discontinued due to the annual mean measurements being consistently well below the NO2 annual mean air quality objective. Of the remaining sites and those subsequently set up, only site IOW 4 has shown exceedences in the last two years. However façade corrections at this location suggest that exceedences are unlikely.
8.2 Conclusions from Assessment of Sources
Since the 2006 USA the Council has identified three key areas which in line with the TG (09) were required to be assessed in this report. These were:
- The Medina Way/Forest Road junction, which showed an AADT of 40,567 and receptors within 15 metres;
- Two road links showing increases of greater than 25% since the 2005 traffic data set; and
- Five new authorised processes which included two mobile crushers and three waste oil burners.
Assessment of all the above has not identified any likely exceedences of any of the prescribed air quality objectives, therefore a Detailed Assessment is not required.
8.3 Proposed Actions
In line with in LAQM.TG(09) guidance, no potential exceedences of the air quality objectives have been identified. Therefore there is no need for the Council to move to a Detailed Assessment at this time.
The Council has historically identified the busiest road links and either set up local monitoring or performed DMRB screening assessments to assess ambient concentrations. With consideration to the current air quality monitoring that takes place on the Island and the annual mean results, no requirement for new monitoring locations have been identified.
The Council is committed to continue to monitor air quality on the Island as well as any new or altered development that may have implications for local air quality. The Council will update and report these findings in its 2010 Air Quality Progress Report.
9 References
Isle of Wight Council, Round 1 Review and Assessment (Stage’s I to III)
Isle of Wight Council, Updating and Screening Assessment, 2004.
Isle of Wight Council, Detailed Assessment, 2004.
Isle of Wight Council, Air Quality Progress Report, 2005.
Isle of Wight Council Updating and Screening Assessment, 2006.
Defra, Part IV of the Environmental Act 1995 Local Air Quality Management Technical Guidance LAQM.TG(09), 2009.
UK Air Quality Archive, Nitrogen Dioxide Fall Off With Distance Calculator Issue 2: 16/03/2009. http://www.airquality.co.uk/archive/laqm/tools.php
Design Manual for Roads and Bridges Screening Method (DMRB), Version 1.03c, July 2007.
UK Air Quality Archive, NOx from NO2 Calculator, Version 1.1, 19/12/2008. http://www.airquality.co.uk/archive/laqm/tools.php
UK Air Quality Archive, Estimated Background Air Pollution Maps for 2006 and Projections for Other Years, 2009. http://www.airquality.co.uk/archive/laqm/tools.php?tool=background06
Local Authority Air Quality Support, NO2 Diffusion Tube QA/QC, WASP Rounds 98 – 102 (Aug 2008 – Oct 2008)
http://www.laqmsupport.org.uk/Summary_of_Laboratory_Performance_in_WASP_R98-102.pdf
Air Quality Review and Assessment Website, Nitrogen Dioxide Diffusion Tube Bias Adjustment, Version 05/09. http://www.uwe.ac.uk/aqm/review/
Air Pollution in the UK: 2003, A report prepared by the National Environmental Technology Centre (Netcen) for the Department for Environment, Food and Rural Affairs and the Devolved Administrations.
Appendices
Appendix A: QA/QC Data
Appendix B: DMRB Calculations
Appendix C: Traffic data
Appendix D: Diffusion Tube Results Close to the Annual Mean Objective
Appendix E: Monthly Nitrogen Dioxide Concentrations 2008
Appendix F: LAPPC Authorised Processes
Appendix A: QA:QC Data
Diffusion Tube Bias Adjustment Factors
Bias adjustment is effectively a calculated factor which shows whether diffusion tubes are over or under reading ambient concentrations and therefore allows for a correction to be made.
As there is no local automatic monitoring, Isle of Wight Council uses a national factor as given on the review and assessment help desk website[2] for Bureau Veritas (Gradko 50% TEA in acetone).
Factor from Local Co-location Studies (if available)
As the council does not carry out any continuous monitoring on the Island the national bias adjustment factor for Bureau Veritas (Gradko 50% TEA in acetone) has instead been used. The factors used in this assessment are as follows:
2000- 1.2
2001- 1.45
2002- 1.27
2003- 1.11
2004- 1.1
2005- 1.1
2006- 1.01
2007- 0.98
2008- 0.93
Discussion of Choice of Factor to Use
The Council has used the national factor for Bureau Veritas (Gradko 50% TEA acetone) as no local continuous monitoring is carried out.
PM Monitoring Adjustment
The Council does not carry out any local monitoring for PM10.
Short-term to Long-term Data adjustment
Of the NO2 diffusion tube datasets for 2008 Sites 4 and Site 11 have a data capture of less than 90% (62% and 58% respectively). The period mean adjustment for Site 4 2007 and Sites 4 and 11 for 2008 are given below.
Table A1. 2007 August to December (Site 4)
Table A1. 2007 August to December (Site 4)
| Site | Site Type | Annual Mean | Period Mean | Ratio |
| Preston Park | Background | 21.7 | 23.8 | 0.91 |
| Portsmouth | Background | 22.8 | 26.9 | 0.85 |
| | | | Average | 0.88 |
Table A2. 2008 May to December (Site 4)
| Site | Site Type | Annual Mean | Period Mean | Ratio |
| Preston Park | Background | 19.8 | 18.1 | 1.09 |
| Portsmouth | Background | 21.5 | 21.2 | 1.01 |
| | | | Average | 1.05 |
Table A3. 2008 July to December (Site 11)
| Site | Site Type | Annual Mean | Period Mean | Ratio |
| Preston Park | Background | 19.8 | 19 | 1.04 |
| Portsmouth | Background | 21.5 | 22.5 | 0.95 |
| | | | Average | 1.00 |
QA/QC of automatic monitoring
No automatic monitoring is carried out on the Island.
QA/QC of diffusion tube monitoring
The Workplace Analysis Scheme for Proficiency (WASP) is an independent analytical performance testing scheme, operated by the Health and Safety Laboratory (HSL). WASP formed a key part of the former UK NO2 Network’s QA/QC, and remains an important QA/QC exercise for laboratories supplying diffusion tubes to Local Authorities for use in their Local Air Quality Management work.
Defra and the Devolved Administrations advise that diffusion tubes used for LAQM should be obtained from laboratories that have demonstrated satisfactory performance in the WASP scheme.
Out of a rating of GOOD, ACCEPETABLE, WARNING AND FAILURE, the results for 2008 show that Bureau Veritas (Gradko) were rated as GOOD. This is classified as follows:
GOOD: Results obtained by the participating laboratory, Bureau Veritas (Gradko 50% TEA in acetone) are on average within 13% of the assigned value. This equates to an RPI of 169 or less.
Appendix B: DMRB Calculations
The input data into the DMRB calculations are shown below.
Table B1. DMRB Input Data (1)
The input data into the DMRB calculations are shown below.
Table B1. DMRB Input Data (1)
| Grid Ref | Background Concentrations | ||||
| Year | NOx | NO2 | PM10 | ||
| Corner of Medina Way and Forest Road | 449384/90145 | 2008 | 14.7 | 12.5 | 16.3 |
Table B2. DMRB Input Data (2)
| Link | Distance to receptor (m) | Traffic flow & speed | Traffic composition | |||
| AADT | Speed (km/h) | Road type (A,B,C,D) | Total % LDV (<3.5t GVW) | Total % HDV (>3.5t GVW) | ||
| 1 | 15 | 8480 | 32 | A | 93.7 | 6.3 |
| 2 | 45 | 32087 | 48 | A | 93 | 7 |
As stated in the report it was not possible to verify the results as no current local monitoring data exists, therefore a comparison was made with the 2004 annual mean from Site IOW 4. The close correlation in modelled and monitored results as discussed in Section 3.4.1 gave confidence in the modelled result.
Table B3. DMRB Results
| Pollutant | Annual mean | |||
| Background concentration | Road traffic component | Total | Units | |
| NOx | 14.7 | 24.6 | 39.3 | µg/m3 |
| NO2 | N/A | 11.2 | 22.3 | µg/m3 |
| PM10 | 16.3 | 2.69 | 19.0 | µg/m3 |
| PM10 Days >50mg/m3 | N/A | N/A | 2 | µg/m3 |
Figure B1. DMRB Receptor Location
Appendix C: Traffic data
| Location | AADT | Annual change (AADT) | Annual % change (AADT) | Reviewed in USA 06? | Reviewed in 2009 USA? | ||||||
| 2005 | 2006 | 2007 | 05-06 | 06-07 | 05-07 | 05-06 | 06-07 | 05-07 | |||
| Rolls Hill, Thorness | 1,892 | 2,524 | 2,607 | 632 | 83 | 715 | 33 | 3 | 38 | N | No as very low traffic flow. |
| Fairlee Road, Newport | 17,086 | 19,593 | 20,488 | 2,507 | 895 | 3,402 | 15 | 5 | 20 | Y | No as previously assessed. |
| Whippingham Road, East Cowes | 13,617 | 13,945 | 14,106 | 328 | 161 | 489 | 2 | 1 | 4 | Y | No as previously assessed. |
| Eleanors Grove, Wootton | 16,790 | 16,080 | 17,330 | -710 | 1,250 | 540 | -4 | 8 | 3 | N | No as non canyon-like with large front gardens. |
| Brading Road, Rowborough | 12,040 | 11,850 | 11,954 | -190 | 104 | -86 | -2 | 1 | -1 | Y | No as previously assessed. |
| Lake Hill, Lake | 19,386 | 18,756 | 17,957 | -630 | -799 | -1,429 | -3 | -4 | -7 | N | No as local monitoring results show annual mean below NO2 AQO. |
| Newport Road, Apse Heath | 15,359 | 15,978 | 17,821 | 619 | 1,843 | 2,462 | 4 | 12 | 16 | Y | No as previously assessed. |
| Victoria Avenue, Shanklin | 5,890 | 6,076 | 6,234 | 186 | 158 | 344 | 3 | 3 | 6 | Y | No as previously assessed. |
| Bonchurch Road, Luccombe | 6,081 | 6,792 | 6,441 | 711 | -351 | 360 | 12 | -5 | 6 | N | No as non canyon-like. |
| Military Road, Freshwater | 1,683 | 1,944 | 2,640 | 261 | 696 | 957 | 16 | 36 | 57 | N | No as very low traffic flow. |
| Colwell Road, Totland | 4,712 | 3,675 | 3,851 | -1,037 | 176 | -861 | -22 | 5 | -18 | N | No as very low traffic flow. |
| Yarmouth Road, Shalfleet | 6,867 | 7,694 | 7,692 | 827 | -2 | 825 | 12 | 0 | 12 | N | No as location is rural with scattered cottages. |
| Forest Road, Newport | 9,207 | 11,451 | 10,222 | 2,244 | -1,229 | 1,015 | 24 | -11 | 11 | N | Has been assessed. Not previously assessed as junction with Medina Way. |
| Horsebridge Hill, Newport | 19,085 | 20,858 | 20,556 | 1,773 | -302 | 1,471 | 9 | -1 | 8 | Y | No as previously assessed. |
| Blackwater Road, Newport | 18,569 | 18,806 | 18,883 | 237 | 77 | 314 | 1 | 0 | 2 | N | No as historic monitoring shows annual mean NO2 AQO. |
| Medina Way, Newport | 26,878 | 27,418 | | 540 | -27,418 | -26,878 | 2 | -100 | -100 | N | Has been assessed. Not previously assessed as junction with Forest Road. |
| Briddlesford Road. | 5,817 | 5,843 | 6,036 | 26 | 193 | 219 | 0 | 3 | 4 | N | No as rural and non canyon-like. |
| Newport Road, Godshill | 8,095 | 7,990 | 8,428 | -105 | 438 | 333 | -1 | 5 | 4 | N | No as rural and non canyon-like. Some adjoining tea gardens - AADT <10,000. |
| Ashey Downs Road, Ashey | 9,107 | 10,501 | 10,641 | 1,394 | 140 | 1,534 | 15 | 1 | 17 | N | No as rural and non canyon-like. |
| Newport Road, Afton | 3,515 | 3,795 | 3,780 | 280 | -15 | 265 | 8 | 0 | 8 | N | No as very low traffic flow. |
| Bowcombe Road, Bowcombe | 2,485 | 2,626 | 2,666 | 141 | 40 | 181 | 6 | 2 | 7 | N | No as very low traffic flow. |
Appendix D: Diffusion Tube Results Close to the Annual Mean Objective
Maps of Locations
Maps of Locations
The maps for all monitoring location are given in Section 2. Assessment of the 2008 annual mean nitrogen dioxide diffusion tube results, suggest that prior to facade correction, only Site 10 was above the objective (42.8µg/m3). The subsequent façade correction assessment indicates the site to be below the annual mean objective. Site IOW 4 is shown in Figure D1.
Figure D1. NO2 Diffusion Tube Locations (Sites IOW4)
Appendix E: Monthly Nitrogen Dioxide Concentrations 2008
Table E1. 2008 Monthly Diffusion Tube Results (non adjusted)
| Site Number | Jan | Feb | Mar | Apr | May | Jun | Jul | Aug | Sep | Oct | Nov | Dec |
| IOW4(a) | | | | | 51.2 | 45.1 | 39.5 | 32.7 | 45.7 | 47.6 | 44.2 | 47.3 |
| IOW4(b) | | | | | 55.6 | 43.2 | 39.6 | 37.3 | 43.6 | 43.8 | 47.0 | 44.7 |
| IOW4(c) | 22.0 | 57.4 | | | 51.1 | 48.6 | 43.7 | 38.8 | 41.2 | 44.5 | 42.7 | 50.0 |
| IOW10 | 36.1 | 34.3 | 17.9 | 21.3 | 32.5 | 22.2 | 23.6 | 21.4 | 24.5 | 26.1 | 22.7 | 28.8 |
| IOW11(a) | | | | | | | 36.4 | 27.9 | 38.1 | 30.5 | 30.1 | 32.5 |
| IOW11(b) | | | | | | | 37.5 | 30.1 | 39.2 | 31.3 | 31.8 | 35.3 |
| IOW11(c) | | | | | | | 36.4 | 30.5 | 38.8 | 32.0 | 30.2 | 36.5 |
Appendix F: LAPPC Authorised Processes
Table F1. Part B Authorised Processes since the 2006 USA
| Process | Address | Grid Location | Date of Initial Authorisation | Process Guidance Note |
| Mobile Crusher | *Cheverton Chalk and Gravel, Cheverton Shute, Shorwell, Newport | 445183 84235 | 9/1/08 | PG 3/16 (04) |
| Mobile Crusher | *JPC Demolition, Pritchetts Way, Rookley | 451190 84086 | 30/9/08 | PG 3/16 (04) |
| Waste Oil Burner | CS Vehicle Repairs, Gatcombe | 449345 84673 | 6/1/09 | PG1/1 (04) |
| Waste Oil Burner | On/Off Road Repairs, Newport | 452181 87941 | 5/12/08 | PG1/1 (04) |
| Waste Oil Burner | Rookley Car Centre, Rookley | 451102 084058 | 19 March 2009 | PG1/1 (04) |
*this is the company address and does not necessarily refer to the location of the crushing activities.
[1]Air Pollution in the UK: 2003, A report prepared by the National Environmental Technology Centre (Netcen) for the Department for Environment, Food and Rural Affairs and the Devolved Administrations.
[2] Air Quality Management Resource Centre, University of the West of England http://www.uwe.ac.uk/aqm/review/guidance_05.html
Page last updated on: 18/12/2009