


Air Quality Assessment
Isle of Wight Council
Executive Summary
An Updating and Screening Assessment (USA) has been performed for the seven UK criteria pollutants, for the Isle of Wight. The aim of this assessment is to determine whether there is potential for exceedences of any of the UK National objectives.
Since the last Updating and Screening Assessment, a Detailed Assessment of benzene and sulphur dioxide has been carried out and a Progress Report detailed concerns that exceedences of the nitrogen dioxide air quality objective may be occurring. No changes to industrial processes or other sources have occurred since 2003. An assessment of NO2 and PM10 concentrations at junctions has been carried out for the relevant objective years based on new traffic data.
The results of this USA indicate that a Detailed Assessment for NO2 is required. This is due to the fact that exceedences of the 2005 NO2 UK Air Quality Objective have been exceeded at two monitoring sites in the area over the last three years.
Table of Contents
The Isle of Wight Council has carried out Review and Assessment work since 2000, completing Stage 1 in April 2000. The following points summarise the last Updating and Screening Assessment (USA) from 2004, and the stages which have been undertaken since then.
- 1.1.1 2004
- Updating and Screening Assessment, 2004 by AEA Technology. No AQMAs declared with possible exceptions for benzene and SO2. Therefore a Detailed Assessment was required for these pollutants in 2005.
- 1.1.2 2005
- Detailed Assessment of Benzene and SO2, January 2005 by Faber Maunsell. No AQMAs to be declared, but further monitoring of benzene may be required.
- Progress Report, February 2005. 3 months monitoring of benzene to be carried out, results anticipated July 2006, to be included in Progress Report 2006. Nine NOx monitoring sites maintained until 2005. No possibility of exceedences at sites except at IW4 and IW8, therefore decision made to discontinue all except these two. Detailed Assessment of NOx may be necessary based on exceedences at two sites.
- Progress Report Appraisal, March 2005. Some new locations may be likely to exceed NOx objectives, so a Detailed Assessment may be required. Defra to be informed of decision.
- Benzene Monitoring, October 2005 Results released and no exceedences likely in current situation and so no AQMA declared. With the view to major development on the IOW in the future years, further monitoring may be necessary. See Appendix C for results.
Diffusion tube bias correction factors have previously been applied incorrectly to IW8. These therefore need to be checked to determine whether Air Quality Objectives have been exceeded at this location. If this is the case then exceedences may be occurring at additional locations. Monitoring at these locations would then be necessary and a Detailed Assessment for NOx would be required.
There are several proposed major developments proposed for the Isle of Wight. Two major developments include The East Cowes Project, which involves the demolition of several buildings to accommodate a proposed mixed use development and a second major development in the East Cowes/ Whippingham area. These proposed developments have the potential to impact upon traffic flows and new roads may need to be built, which could also impact upon air quality.
Traffic data was supplied by the IOW Council and is included in Appendix A.
The Isle of Wight has 4 Part A Industrial Processes, these are included in Appendix B. A full list of the 53 Part B Industrial Processes can be found in the Stage 2 Report.
Monitoring data which has been collected since the last Updating and Screening Assessment is included in Appendices C and D. This includes nitrogen dioxide diffusion tube data and benzene diffusion tube data.
The Ordnance Survey Mapping used in this assessment was reproduced from the Ordnance Survey Map with Permission of the Controller of Her Majesty's Stationery Office. The mapping was provided by the Isle of Wight Council © Crown Copyright Reserved License No.DWIG150.
- 1.3 Overview of Air Quality Legislation and Policy
- 1.3.1 Overview of Recent Air Quality Legislation and Policy
The provisions of Part IV of the Environment Act 1995 establish a national framework for air quality management, which requires all local authorities in England, Scotland and Wales to conduct local air quality reviews. Section 82(1) of the Act requires these reviews to include an assessment of the current air quality in the area and the predicted air quality in future years. Should the reviews indicate that the standards prescribed in the National Air Quality Strategy (NAQS) and the Addendum to the Strategy will not be met, the local authority is required to designate an Air Quality Management Area (AQMA). Action must then be taken at a local level to ensure that air quality in the area improves. This process is known as ‘local air quality management’.
The second round of the review and assessment process has been split into two phases: an Updating and Screening Assessment and a Detailed Assessment.
The first phase, the Updating and Screening Assessment, has been designed to review the changes in air quality issues that have occurred within each local authority since the first round of review and assessment. These changes are assessed using appropriate screening methods. Therefore, it should cover:
- new monitoring data
- new objectives
- new sources of pollution
- significant changes to existing sources of pollution.
The Updating and Screening Assessment also re-examines locations and sources, e.g. road junctions, bus stations, domestic burning, fugitive sources, etc., that have been highlighted as issues during the previous round of review and assessment.
Where the Updating and Screening Assessment has identified a risk that an air quality objective may be exceeded, the local authority must undertake a Detailed Assessment. The aim of this assessment is to determine with as much certainty as is possible whether or not an air quality objective will be exceeded. If an exceedence is predicted, the local authority should designate an AQMA to cover the area of the exceedence.
The NAQS identifies eight ambient air pollutants that have the potential to cause harm to human health. These pollutants are associated with local air quality problems, with the exception of ozone, which is instead considered to be a regional problem.
The Air Quality Regulations set standards for the seven pollutants that are associated with local air quality. These objectives aim to reduce the health impacts of the pollutants to negligible levels. The standards stated in the Air Quality Regulations are listed in Table 1.
The revised objectives for benzene, carbon monoxide and suspended particulate matter (PM10), as detailed in the ‘Air Quality (England)(Amendment) Regulations 2002’, are included.
Table 1: UK Objectives included in the Air Quality Regulations 2000 and (Amendment) Regulations 2002
| Pollutant | Air Quality Objective | Date to be achieved by | |
| Concentration | Measured as | ||
| Benzene | 16.25 μg/m3 All authorities | running annual mean | 31.12.2003 |
| 5.0 μg/m3 Authorities in England and Wales only | annual mean | 31.12.2010 | |
| 1,3-Butadiene | 2.25 μg/m3 | running annual mean | 31.12.2003 |
| Carbon monoxide | 10.0 mg/m3 Authorities in England, Wales and N. Ireland. | maximum daily running 8-hour mean | 31.12.2003 |
| Lead | 0.5 μg/m3 | annual mean | 31.12.2004 |
| 0.25 μg/m3 | 31.12.2008 | ||
| Nitrogen dioxide | 200 μg/m3 not to be exceeded more than 18 times a year | 1 hour mean | 31.12.2005 |
| 40 μg/m3 | annual mean | 31.12.2005 | |
| Particles (PM10) (gravimetric) All authorities | 50 μg/m3 not to be exceeded more than 35 times a year | 24 hour mean | 31.12.2004 |
| 40 μg/m3 | annual mean | 31.12.2004 | |
| Particles (PM10) (gravimetric) Provisional objectives for England (not London) and Wales | 50 μg/m3 not to be exceeded more than 7 times a year | 24 hour mean | 31.12.2010 |
| 20 μg/m3 | annual mean | 31.12.2010 | |
| Sulphur dioxide | 350 μg/m3 not to be exceeded more than 24 times a year | 1 hour mean | 31.12.2004 |
| 125 μg/m3 not to be exceeded more than 3 times a year | 24 hour mean | 31.12.2004 | |
| 266 μg/m3 not to be exceeded more than 35 times a year | 15 minute mean | 31.12.2005 | |
| Checklist Item (from Box 2.2) | Updating and Screening Assessment |
| Monitoring Data A) Monitoring data | Carbon monoxide is not monitored on the Isle of Wight |
| Road Traffic- B) Very busy roads or junctions in built-up areas | There are no very busy roads or junctions on the Isle of Wight (i.e. single carriageway roads where the AADT>80,000, or dual carriageway roads where the AADT>120,000, or motorways where the AADT>140,000). The busiest road in the authority is Medina Way which has an AADT of 34,334 (2005). |
| Conclusion | The assessment has indicated that the CO objective is unlikely to be exceeded at any location on the island, and therefore a Detailed Assessment for this pollutant will not be required. |
| Checklist Item ( from Box 3.2 in TG(03) | Updating and Screening Assessment |
| Monitoring Data A) Monitoring data outside an AQMA | Following a Detailed Assessment in January 2005, benzene was monitored for three months during 2005 and no exceedences were predicted. No AQMA was declared, but further monitoring may be necessary as a result of future developments on the island. Monitoring data are presented in Appendix C. |
| B) Monitoring data within an AQMA | |
| Road Traffic- C) Very busy roads or junctions in built-up areas | There are no very busy roads or junctions on the Isle of Wight (i.e. single carriageway roads where the AADT>80,000, or dual carriageway roads where the AADT>120,000, or motorways where the AADT>140,000). The busiest road in the authority is Medina Way which has an AADT of 34,334 (2005). |
| Industrial Sources D) New industrial sources | There are no petroleum processes or other industrial processes that emit sufficient quantities of benzene on the Isle of Wight, nor have there been any changes since the previous USA to consider for the purpose of this assessment. |
| E) Industrial sources with substantially increased emissions, or new relevant exposure. | |
| Other Sources F) Petrol stations | There are no petrol filling stations with an annual throughput of more than 2 million litres per year, near to a busy road (>30,000 vehicles per day), and within 10m of a sensitive receptor. |
| G) Major fuel storage depots (petrol only) | The only major fuel depot within the authority is located at East Cowes and has a throughput of 50 million litres per annum. Monitoring using passive diffusion tubes at this location has shown that no exceedences of the objective are likely. |
| Conclusion | Monitoring data taken during 2005 following the Detailed Assessment has indicated that the benzene objectives are unlikely to be exceeded at any location on the island, including the major fuel depot, and no further action will be required. |
| Checklist Item (from Box 4.2) | Updating and Screening Assessment |
| Monitoring Data A) Monitoring data | 1,3-butadiene is not monitored on the Isle of Wight. |
| Industrial Sources B) New industrial sources | There are no new industrial processes within the Isle of Wight or within neighbouring authorities, nor are there any industrial sources with increased emissions, or new relevant exposure to consider for the purpose of this assessment. |
| C) Industrial sources with substantially increased emissions, or new relevant exposure. | |
| Conclusion | The assessment has indicated that the 1,3-butadiene objective is unlikely to be exceeded at any location on the island, and therefore a Detailed Assessment for this pollutant will not be required. |
| Checklist Item (from Box 5.1) | Updating and Screening Assessment |
| Monitoring Data A) Monitoring data | Lead is not monitored on the Isle of Wight. |
| Industrial Sources B) New industrial sources | There are no new industrial processes on the Isle of Wight, nor are there industrial sources with increased emissions, or new relevant exposure to consider for the purpose of this assessment. |
| C) Industrial sources with substantially increased emissions, or new relevant exposure. | |
| Conclusion | The assessment has indicated that the lead objectives are unlikely to be exceeded at any location on the island, and therefore a Detailed Assessment for this pollutant will not be required. |
| Checklist Item (from Box 6.2) | Updating and Screening Assessment |
| Monitoring Data A) Monitoring data from outside an AQMA | No AQMA has been declared on the Isle of Wight. In April 2005 the number of sites where nitrogen dioxide is monitored was reduced from nine to two, leaving sites IW4 and IW8. Exceedences were recorded at these two sites in 2003 and 2005 and at IW8 in 2004. Forecast concentrations to 2010 from 2005 results, predicted IW8 to still exceed the 2005 objective in 2010. Concentrations at the nearest property to IW4 were predicted to exceed the objective, but concentrations at the closest property to IW8 were predicted to be below the objective. A Detailed Assessment is recommended on the basis of these results. See Appendix D for further details. |
| B) Monitoring data within an AQMA | |
| Road Traffic- C) Narrow congested streets with residential properties close to the kerb | There has been no change since the previous USA; there are no narrow congested streets with residential properties close to the kerb where there is an AADT flow of above 10,000. |
| Checklist Item (from Box 6.2) | Updating and Screening Assessment |
| D) Junctions | The previous round of Review and Assessment did not assess any junctions, but locations with a combined AADT of over 10,000 and with relevant exposure within 10 m of the kerb have been identified. Twelve junctions were assessed using the DMRB Methodology and no exceedences of the objectives were predicted for 2005 or 2010. Concentrations of NO2 were predicted to decrease between 2005 and 2010. See Appendix E. |
| E) Busy streets where people may spend 1 hour or more close to traffic | There has been no change since the previous USA; there are no busy streets where people may spend 1 hour or more close to traffic where there is an AADT flow of above 10,000. |
| F) Road with high flow of buses and/or HGVs | There has been no change since the previous USA; there are no roads with unusually high flows of buses and/or HGVs (i.e. greater than 25%) |
| G) New roads constructed or proposed since the previous round of R &A | There have been no new roads constructed or proposed since the previous USA. |
| H) Roads with significantly changed traffic flows, or new relevant exposure. | No roads with an AADT of >10,000 have shown a significant increase (>25%) in traffic flow. There is no new relevant exposure. |
| I) Bus stations | There are no bus stations on the Isle of Wight with relevant exposure within 10 m of the kerb. |
| Industrial Sources J) New industrial sources | There are no new industrial processes on the Isle of Wight or within neighbouring authorities, nor are there industrial sources with increased emissions, or new relevant exposure to consider for the purpose of this assessment. |
| K) Industrial sources with substantially increased emissions, or new relevant exposure. | |
| Other Sources L) Aircraft | There are two airfields on the Isle of Wight, both of which are used for recreational flights only. There are no commercial flights from these airfields. These airfields will not be considered further for the purpose of this assessment. |
| Conclusion | Exceedences at IW8 and IW4 have occurred in the past three years. It is therefore likely that exceedences could be occurring at other locations on the island. Further monitoring at sites where the public could be exposed to these levels is therefore recommended and a Detailed Assessment is required for this pollutant. |
| Checklist Item (from Box 7.2) | Updating and Screening Assessment |
| Monitoring Data A) Monitoring data from outside an AQMA | Sulphur dioxide is not monitored on the Isle of Wight and no AQMA was declared following the Detailed Assessment in January 2005. |
| B) Monitoring data within an AQMA | |
| Industrial Sources C) New industrial sources | There are no new industrial processes on the Isle of Wight or within neighbouring authorities, nor are there industrial sources with increased emissions, or new relevant exposure to consider for the purpose of this assessment. |
| D) Industrial sources with substantially increased emissions, or new relevant exposure. | |
| Domestic Sources E) Areas of domestic coal burning | There are no known areas where significant domestic coal (or smokeless fuel) burning takes place. |
| Boilers F) Small boilers >5MW( thermal) | There are no known boilers of greater than 5MW that burn coal or oil on the island. |
| Other Sources G) Shipping | There are three car ferry terminals on the Isle of Wight with significant numbers of shipping movements per year (> 5000) and there are relevant receptors within 1 km of the ports. There have been no changes since the last round of Review and Assessment and the Detailed Assessment in 2005 predicted that exceedences were not likely and that the impact of the ship emissions upon local receptors was not significant. No AQMA was declared. |
| H) Railway :Locomotives | There is one preserved railway on the Island, operated by two small steam locomotives but there are no locations where diesel locomotives or steam locomotives are regularly stationary for 15 minutes where members of the public may be exposed. |
| Conclusion | The assessment has indicated that the sulphur dioxide objectives are unlikely to be exceeded at any location on the island, and therefore a Detailed Assessment will not be required for this pollutant. |
| Checklist Item (from Box 8.4) | Updating and Screening Assessment |
| Monitoring Data A) Monitoring data from outside an AQMA | PM10 is not monitored on the Isle of Wight and there is no AQMA on the island. |
| B) Monitoring data within an AQMA |
| Checklist Item (from Box 8.4) | Updating and Screening Assessment |
| Road Traffic- C) Busy roads or junctions in Scotland | N/A |
| D) Junctions | The previous round of Review and Assessment did not assess any junctions, but locations with a combined AADT of over 10,000 and with relevant exposure within 10 m of the kerb have been identified. Twelve junctions were assessed using the DMRB Methodology and no exceedences of the 2004 PM10 objective were predicted for 2005. Exceedences of the 2010 objective were predicted at six of the twelve junctions but it should be noted that this objective is provisional. See Appendix E. |
| E) Roads with high flow if buses and/or HGVs | There has been no change since the previous round of assessment; there are no roads with unusually high flows of buses and/or HGVs (i.e. greater than 20%) |
| F) New roads constructed or proposed since last round of R&A | There have been no new roads constructed or proposed since the previous round of Review and Assessment. |
| G) Roads with significantly changed traffic flows, or new relevant exposure | No roads with an AADT of >10,000 have shown a significant increase (>25%) in traffic flow. There is no new relevant exposure. |
| H) Roads close to the objective during the second round of R&A | There were no roads close to the objective during the second round of Review and Assessment (the greatest number of daily exceedences predicted in 2004, at a sensitive receptor, was 8). |
| Industrial Sources I) New industrial sources | There are no new industrial processes on the Isle of Wight or within neighbouring authorities, nor are there industrial sources with increased emissions, or new relevant exposure to consider for the purpose of this assessment. |
| J) Industrial sources with substantially increased emissions, or new relevant exposure. | |
| Domestic Sources K) Areas of domestic fuel burning | There are no known areas where significant domestic solid fuel burning takes place. |
| Other Sources L) Quarries/ landfill / opencast coal / handling of dusty cargo at ports etc | There are ten areas of quarrying activity on the Isle of Wight, but these have not changed since their assessment in the Stage 2 Review. |
| M) Poultry Farms | There are no poultry farms on the island where it is thought likely that emissions of PM10 could contribute to exceedences of the PM10 objectives. |
| N) Aircraft | There are two airfields on the Isle of Wight, both of which are used for recreational flights only. There are no commercial flights from these airfields. These airfields will not be considered further for the purpose of this assessment. |
| Conclusion | The assessment has indicated that the PM10 objectives are unlikely to be exceeded at any location on the island, and therefore a Detailed Assessment will not be required for this pollutant. |
The criteria for each of the seven pollutants has been assessed according to the guidance contained within LAQM.TG(03), and its January 2006 update. It is concluded that the national air quality objectives for carbon monoxide, benzene, 1-3-butadiene, lead, sulphur dioxide and PM10 are unlikely to be exceeded at any location on the Isle of Wight and therefore a Detailed Assessment of these pollutants will not be required. Monitoring of nitrogen dioxide on the island has revealed exceedences at two diffusion tube sites in 2005. Concentrations at one site are forecast to still exceed objectives in 2010.Therefore a Detailed Assessment of nitrogen dioxide is required.
| Town | Road | Date of Count | Total | No. Flows |
| Newport | Medina Way | 05/08/2002 | 32660 | 2 |
| Newport | Horsebridge Hill | 06/08/2001 | 25776 | 2 |
| Lake | Lake Hill | 28/07/2003 | 23088 | 2 |
| Newport | Fairlee Road | 06/08/2001 | 21848 | 2 |
| Newport | Blackwater Road | 11/08/2003 | 21136 | 2 |
| Wootton | Eleanors Grove | 20/08/2001 | 19676 | 2 |
| Apse Heath | Newport Road | 05/08/2002 | 17409 | 2 |
| Wootton | Lushington Hill | 07/10/2002 | 15990 | 2 |
| East Cowes | Whippingham Road | 20/08/2001 | 15484 | 2 |
| Ryde | Quarr Hill | 14/07/2003 | 14446 | 2 |
| Lake | Newport Road | 12/05/2003 | 14440 | 2 |
| Newport | Carisbrooke Road | 29/07/2001 | 13886 | 2 |
| Brading | Brading Road | 19/08/2002 | 13863 | 2 |
| Newport | Forest Road | 23/06/2003 | 13035 | 2 |
| Whippingham | Main Road | 31/05/2003 | 12348 | 2 |
| Sandown | Broadway | 01/04/2002 | 12283 | 2 |
| Newport | Forest Road | 20/08/2001 | 11979 | 2 |
| Ryde | St Johns Hill | 18/05/2001 | 11740 | 2 |
| Newport | Fairlee Road | 09/07/2001 | 11450 | 1 |
| Newport | Cross Lane | 21/05/2001 | 10439 | 1 |
| Shanklin | Sandown Road | 02/12/2002 | 9920 | 2 |
| Ryde | Green Street | 01/10/2001 | 9883 | 2 |
| Newport | Blackwater Road | 30/06/2003 | 9749 | 1 |
| Wootton | High Street | 30/06/2003 | 9710 | 1 |
| Ryde | Binstead Hill | 09/06/2003 | 9417 | 1 |
| Ryde | Ashey Downs Road | 08/09/2003 | 9205 | 2 |
| Godshill | Newport Road | 05/08/2002 | 9055 | 2 |
| Shalfleet | Yarmouth Road | 20/08/2001 | 8887 | 2 |
| St Helens | Station Road | 12/08/2002 | 8192 | 2 |
| Lake | Newport Road | 13/01/2003 | 7905 | 1 |
| Lake | Newport Road | 06/01/2003 | 7774 | 1 |
| Wroxall | St Johns Road | 18/08/2003 | 7461 | 2 |
| Newport | Staplers Road | 09/06/2003 | 7268 | 1 |
| Freshwater | Newport Road | 04/08/2003 | 7202 | 2 |
| Yarmouth | Tennyson Road | 10/09/2001 | 7062 | 2 |
| Godshill | Newport Road | 04/11/2002 | 6734 | 2 |
| Brading | High Street | 16/06/2003 | 6613 | 1 |
| Ryde | St Johns Road | 03/02/2003 | 6594 | 1 |
| Brading | New Road | 08/07/2002 | 6509 | 1 |
| Shanklin | Bonchurch Road | 13/08/2001 | 6500 | 2 |
| Brading | Beaper Shute | 01/04/2002 | 6452 | 1 |
| Shanklin | Victoria Avenue | 28/07/2003 | 6415 | 2 |
| St Helens | Carpenters Road | 14/07/2003 | 6364 | 2 |
| Wootton | Briddlesford Road | 05/08/2002 | 6344 | 2 |
| Apse Heath | Newport Road | 08/07/2002 | 6296 | 1 |
| Freshwater | Newport Road | 14/07/2003 | 6079 | 2 |
| Ryde | Great Preston Road | 23/09/2002 | 5974 | 2 |
| Arreton | Hale Common | 17/03/2003 | 5965 | 1 |
| Shanklin | Old Village | 26/05/2002 | 5957 | 2 |
| Arreton | Main Road | 11/02/2002 | 5947 | 1 |
| Northwood | Nodes Road | 02/04/2001 | 5925 | 2 |
| Wootton | Lushington Hill | 21/05/2001 | 5796 | 1 |
| Wootton | Fishbourne Lane | 18/08/2003 | 5725 | 2 |
| Brading | High Street | 27/05/2002 | 5547 | 1 |
| Ryde | St Johns Road | 19/11/2001 | 5251 | 1 |
| Town | Road | Date of Count | Total | No. Flows |
| Totland | The Broadway | 11/06/2001 | 5162 | 2 |
| Shanklin | Victoria Avenue | 23/09/2002 | 5102 | 2 |
| Havenstreet | Main Road | 19/08/2002 | 5099 | 2 |
| Totland | Colwell Road | 25/08/2003 | 5013 | 2 |
| Sandown | Perowne Way | 24/09/2001 | 4927 | 2 |
| Ryde | Pellhurst Road | 14/07/2003 | 4907 | 2 |
| Sandown | Culver Parade | 09/06/2003 | 4898 | 2 |
| Yarmouth | Bouldnor Road | 13/01/2003 | 4852 | 2 |
| Brading | Brading Down Road | 18/08/2003 | 4843 | 2 |
| Ryde | Stroudwood Road | 19/08/2002 | 4603 | 2 |
| St Helens | Carpenters Road | 04/11/2002 | 4578 | 2 |
| Brading | Beaper Shute | 08/04/2002 | 4498 | 1 |
| Freshwater | Tennyson Road | 27/08/2001 | 4492 | 1 |
| Ryde | East Hill Road | 29/04/2002 | 4393 | 1 |
| Bembridge | Embankment Road | 03/02/2003 | 4238 | 2 |
| Wootton | Park Road | 25/06/2001 | 4233 | 2 |
| Cowes | Baring Road | 22/01/2002 | 4210 | 2 |
| Cowes | Mill Hill Road | 14/07/2003 | 4159 | 2 |
| Havenstreet | Main Road | 19/08/2002 | 3949 | 2 |
| Freshwater | Military Road | 13/08/2001 | 3938 | 2 |
| East Cowes | Victoria Grove | 30/06/2003 | 3913 | 2 |
| Freshwater | The Avenue | 13/01/2003 | 3882 | 2 |
| Shalfleet | Watchingwell | 05/08/2002 | 3811 | 1 |
| Ventnor | Albert Street | 18/06/2001 | 3755 | 1 |
| Ryde | Ashey Road | 04/02/2002 | 3747 | 2 |
| Cowes | Mill Hill Road | 11/06/2001 | 3594 | 2 |
| Ryde | St Thomas Street | 08/03/2003 | 3571 | 2 |
| Newport | Shide Road | 29/10/2001 | 3496 | 2 |
| East Cowes | York Avenue | 12/05/2003 | 3483 | 1 |
| Whitwell | Ventnor Road | 28/07/2003 | 3427 | 2 |
| Ventnor | St Boniface Road | 29/07/2002 | 3346 | 2 |
| Ryde | High Street | 13/05/2002 | 3309 | 1 |
| Newport | Clatterford Road | 15/10/2001 | 3283 | 2 |
| Calbourne | Main Road | 15/10/2001 | 3283 | 2 |
| Ventnor | Upper Gills Cliff Road | 13/08/2001 | 3274 | 2 |
| Shanklin | Brook Road | 28/04/2003 | 3270 | 2 |
| Gurnard | Main Road | 09/07/2001 | 3169 | 2 |
| Ventnor | Leeson Road | 11/02/2002 | 3064 | 2 |
| Freshwater | Military Road | 03/06/2002 | 2972 | 2 |
| Cowes | Rolls Hill | 05/08/2002 | 2954 | 2 |
| Newchurch | Main Road | 08/04/2002 | 2847 | 2 |
| Newport | Bowcombe Road | 14/07/2003 | 2758 | 2 |
| Newport | Crocker Street | 19/02/2001 | 2708 | 1 |
| Shanklin | Victoria Avenue | 25/11/2002 | 2684 | 1 |
| Newport | Bowcombe Road | 17/02/2003 | 2668 | 2 |
| Ryde | Upton Road | 11/11/2002 | 2644 | 2 |
| Yarmouth | Yarmouth Road | 12/03/2001 | 2597 | 1 |
| Ryde | High Park Road | 18/03/2002 | 2559 | 2 |
| Newport | Whitcombe Road | 09/11/2002 | 2524 | 2 |
| Niton | Chatfield Road | 28/07/2003 | 2485 | 2 |
| Whitwell | High Street | 30/04/2001 | 2434 | 2 |
| Niton | Undercliff Drive | 28/07/2003 | 2350 | 2 |
| Niton | Chatfield Road | 05/11/2001 | 2304 | 2 |
| Northwood | Pallance Road | 28/04/2003 | 2299 | 2 |
| Ryde | Warwick Street | 22/01/2001 | 2242 | 1 |
| Newport | Furrlongs | 15/10/2001 | 2153 | 2 |
| Rookley | Niton Road | 22/01/2001 | 2134 | 2 |
| Ryde | Harding Road | 28/10/2002 | 1981 | 2 |
| Havenstreet | Main Road | 23/07/2001 | 1977 | 1 |
| Gurnard | Worsley Road | 16/12/2002 | 1915 | 2 |
| Town | Road | Date of Count | Total | No. Flows |
| Newport | West Street | 12/02/2001 | 1865 | 1 |
| Ryde | Well Street | 19/11/2001 | 1727 | 2 |
| Brading | Coach Lane | 31/03/2003 | 1712 | 2 |
| Freshwater | Copse Lane | 28/04/2003 | 1686 | 2 |
| Freshwater | Copse Lane | 28/04/2003 | 1664 | 2 |
| Cowes | Medina Road | 28/04/2003 | 1656 | 2 |
| Newport | Sylvan Drive | 10/06/2002 | 1651 | 2 |
| Brighstone | New Road | 09/04/2001 | 1588 | 2 |
| Lake | James Avenue | 16/09/2002 | 1579 | 2 |
| Ryde | Bullen Road | 02/04/2001 | 1561 | 2 |
| Ventnor | Belgrave Road | 17/03/2003 | 1514 | 2 |
| Yarmouth | James Street | 31/03/2003 | 1399 | 1 |
| Brook | Brook Village Road | 10/03/2003 | 1290 | 2 |
| Ventnor | Grove Road | 28/04/2003 | 1261 | 2 |
| Gurnard | Solent View Road | 20/01/2003 | 1202 | 2 |
| Porchfield | Bunts Hill | 14/10/2002 | 1196 | 2 |
| Chillerton | Main Road | 22/04/2002 | 1185 | 2 |
| Ryde | Mayfield Road | 05/02/2001 | 1168 | 2 |
| St Helens | Latimer Road | 24/09/2001 | 1164 | 2 |
| Gurnard | Church Road | 20/01/2003 | 1126 | 2 |
| Newport | Watergate Road | 21/01/2002 | 1124 | 2 |
| Chale | Chale Street | 11/11/2002 | 1098 | 2 |
| Newchurch | Newchurch Shute | 30/04/2001 | 1041 | 1 |
| Chillerton | Main Road | 22/04/2002 | 1024 | 2 |
| Newport | Castle Road | 12/03/2001 | 1012 | 1 |
| Niton | Undercliff Drive | 10/03/2003 | 985 | 2 |
| Calbourne | Elm Lane | 18/08/2003 | 974 | 2 |
| Gurnard | Marsh Road | 07/04/2003 | 923 | 2 |
| Gurnard | Rew Street | 07/04/2003 | 836 | 2 |
| Chillerton | Main Road | 22/04/2002 | 754 | 2 |
| Brighstone | Hunnyhill | 12/11/2001 | 659 | 2 |
| Whippingham | Alverstone Road | 18/08/2003 | 649 | 2 |
| Brading | Upper Adgestone Road | 20/08/2001 | 626 | 2 |
| Ventnor | Dudley Road | 23/09/2002 | 577 | 1 |
| Newport | Sandy Lane | 03/12/2001 | 574 | 2 |
| Gurnard | Lower Church Road | 09/12/2002 | 550 | 2 |
| Shalfleet | Main Road | 14/10/2002 | 536 | 2 |
| Freshwater | Blackbridge Road | 14/01/2002 | 514 | 2 |
| Godshill | Southford Lane | 11/03/2002 | 506 | 2 |
| Newport | Sandy Lane | 03/12/2001 | 499 | 2 |
| Newport | Alvington Manor View | 07/04/2003 | 435 | 2 |
| Newport | Church Lane | 09/07/2001 | 369 | 2 |
| Gurnard | Avenue Road | 09/12/2002 | 368 | 2 |
| Wootton | Brocks Copse Road | 18/02/2002 | 366 | 2 |
| Bembridge | Crossway | 10/03/2003 | 320 | 2 |
| Newport | Elm Grove | 03/09/2001 | 304 | 1 |
| Porchfield | New Road | 15/10/2001 | 298 | 2 |
| Ventnor | Gloucester Road | 22/07/2002 | 293 | 2 |
| Gurnard | Tilbury Road | 09/12/2002 | 284 | 2 |
| Newport | Bowcombe Business Park | 24/02/2003 | 266 | 2 |
| Godshill | Lessland Lane | 31/03/2003 | 260 | 2 |
| Seaview | Oakhill Road | 15/01/2001 | 248 | 2 |
| Town | Road Name | Flow 2005 | Road Type |
| Thorness | Rolls Hill, | 1,866 | C |
| Newport | Fairlee Road, | 15,129 | A |
| East Cowes | Whippingham Road, | 12,575 | A |
| Town | Road Name | Flow 2005 | Road Type |
| Wootton | Eleanors Grove | 15,856 | A |
| Rowborough | Brading Road | 9,667 | A |
| Lake | Lake Hill | 20,193 | A |
| Apse Heath | Newport Road | 15,326 | A |
| Shanklin | Victoria Avenue | 6,010 | A |
| Luccombe | Bonchurch Road | 5,530 | A |
| Freshwater | Military Road | 1,777 | A |
| Totland | Colwell Road | 4,439 | A |
| Shalfleet | Yarmouth Road | 6,749 | A |
| Newport | Forest Road | 9,807 | A |
| Newport | Horsebridge Hill | 22,919 | A |
| Newport | Blackwater Road | 19,173 | A |
| Newport | Medina Way | 30,933 | A |
| Wootton | Briddlesford Road | 4,221 | C |
| Godshill | Newport Road | 7,951 | A |
| Ashey | Ashey Downs Road | 9,285 | C |
| Afton | Newport Road | 4,339 | B |
| Bowcombe | Bowcombe Road | 2,664 | B |
| Operator Name | Authorisation No. | Site Address | Process Type |
| Innogy PLC | AF7169 | Cowes Gt Power Station Kingston Road East Cowes Isle of Wight PO32 6JF | Combustion Processes |
| Contract Heat and Power Ltd | AF8092 | Forest Park Forest Road Newport Isle of Wight PO30 5YS | Combustion Processes |
| GKN Westland Aerospace (Holdings) Ltd | AO0504 | Maresfield Works Maresfield Road East Cowes Isle of Wight PO32 6AF | Inorganic Chemical Processes |
| Island Waste Services Ltd | ISL012/10203 | Bridlesford Road Downend Newport | Landfill sites and waste transfer solutions. |
The results from 3 months of monitoring in 2005 using BTEX passive diffusion tubes are presented in Table 5. This monitoring was undertaken after a Detailed Assessment predicted that there could be exceedences at some locations on the island.
The locations of the tubes were chosen to be as close as possible to the area shown on the modelling study to have the highest concentrations of benzene, close to the Kingston Petrol Storage Terminal. One tube was therefore placed within the Petrol Terminal compound, close to the road-tanker filling stations and the Vapour Recovery Unit (Site 3, SZ50389459). The other two were placed, one at either end of a building within a secure compound belonging to Transco (Sites 1 & 2, SZ50379450 & SZ50389449).
No exceedences of the Air Quality Objective were measured and the Isle of Wight Council has therefore concluded that no AQMA needs to be declared.
Table 5: Benzene Monitoring Results
| | Benzene | Toluene | Ethylbenzene | m + p-Xylene | o-Xylene |
| April | | | | | |
| Site 1 | 0.8 | 5.7 | 5.1 | 9.4 | 4.3 |
| Site 2 | 0.7 | 5.2 | 2.7 | 5.0 | 2.2 |
| Site 3 | 1.0 | 9.4 | 3.3 | 7.0 | 3.0 |
| May | | | | | |
| Site 1 | 0.6 | 5.9 | 0.6 | 1.3 | 0.5 |
| Site 2 | 0.6 | 6.4 | 0.6 | 1.4 | 0.5 |
| Site 3 | 0.8 | 12.3 | 1.2 | 3.3 | 1.3 |
| June | | | | | |
| Site 1 | 0.7 | 8.1 | 0.6 | 1.4 | 0.6 |
| Site 2 | 0.7 | 7.8 | 0.8 | 2.1 | 0.6 |
| Site 3 | 1.0 | 11.2 | 1.5 | 4.5 | 1.7 |
All results are in μg/m3
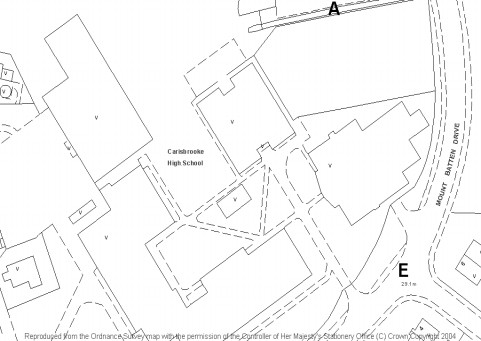
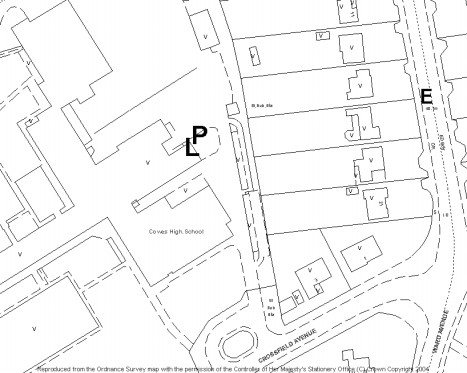
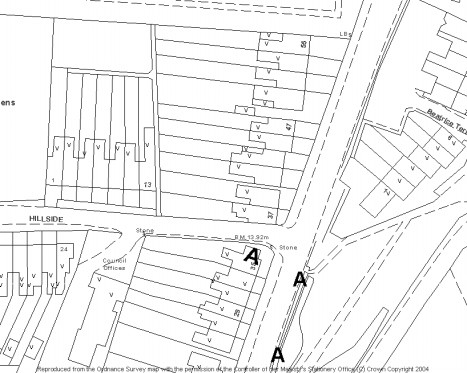
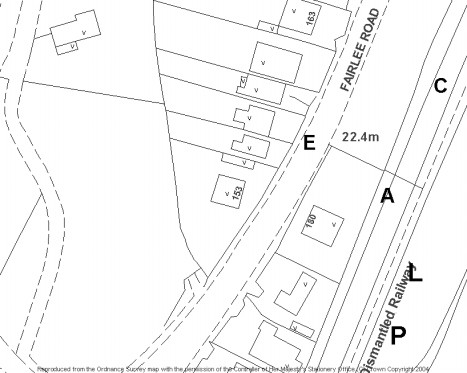
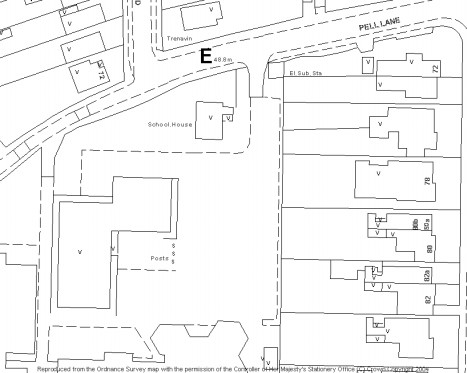
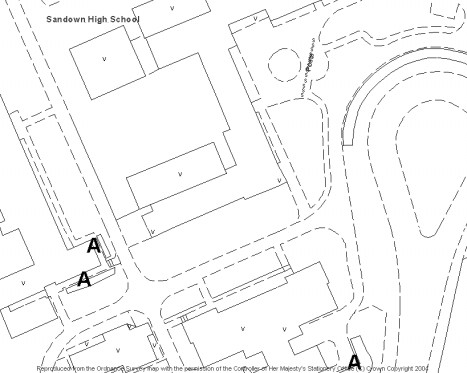
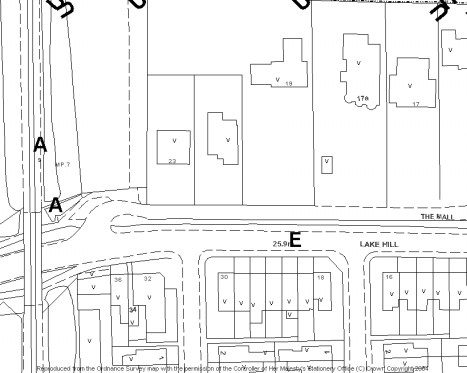
Results of diffusion tube monitoring from 2003, 2004 and 2005 are presented in Tables 6, 7 and 8. Details of the monitoring locations are presented in Figure 1.
| Tube Ref | NO2 /μg/m3 | |||||||||||||
| Jan | Feb | Mar | Apr | May | Jun | Jul | Aug | Sep | Oct | Nov | Dec | Average | Bias Corrected Average | |
| IW1 | 18.6 | 30.1 | 16.5 | 14.6 | 5.8 | 10.1 | 5.7 | 14.2 | 13.8 | 20.0 | 17.8 | 19.4 | 15.5 | 16.8 |
| IW2 | 19.1 | 28.9 | 24.7 | | 6.7 | 11.8 | 5.7 | 18.5 | 16.6 | 19.2 | 8.5 | 21.4 | 16.5 | 17.8 |
| IW3 | 21.6 | 36.0 | 37.1 | 33.6 | 19.6 | 27.3 | 24.6 | 32.7 | 31.0 | 27.8 | 15.6 | 31.4 | 28.2 | 30.4 |
| IW4 | 34.6 | 43.7 | 38.9 | 38.4 | 40.6 | 53.3 | 48.6 | 43.2 | 48.8 | 39.2 | 37.0 | 27.4 | 41.1 | 44.4 |
| IW5 | 17.6 | 27.7 | 37.7 | 31.1 | 20.5 | 26.7 | 19.4 | 21.8 | 17.8 | 27.0 | 10.7 | 26.4 | 23.7 | 25.6 |
| IW6 | 15.6 | 24.8 | 20.0 | 20.7 | 9.4 | 11.2 | | 15.6 | | 21.5 | 15.6 | 20.9 | 17.5 | 19.0 |
| IW7 | 10.0 | 23.6 | 17.7 | 14.0 | 7.6 | 7.1 | 5.7 | 10.4 | 5.7 | 14.5 | 6.4 | 14.5 | 11.4 | 12.4 |
| IW8 | 30.1 | 50.2 | 48.9 | 60.4 | 38.8 | 50.3 | 52.1 | 34.1 | | 37.6 | 14.2 | 37.9 | 41.3 | 44.6 |
| IW9 | 14.5 | 26.0 | 18.3 | 21.9 | 11.6 | 20.1 | 16.6 | 27.0 | 18.4 | 18.4 | 10.6 | 20.0 | 18.6 | 20.1 |
| Tube Ref | NO2 /μg/m3 | |||||||||||||
| Jan | Feb | Mar | Apr | May | Jun | Jul | Aug | Sep | Oct | Nov | Dec | Average | Bias Corrected Average | |
| IW1 | 12.4 | 15.4 | 13.0 | 14.2 | 12.8 | 7.3 | 7.3 | 7.3 | | 11.5 | 14.8 | 18.2 | 12.2 | 13.4 |
| IW2 | 13.6 | | 16.6 | 16.9 | 14.4 | 8.5 | 9.2 | | | 10.8 | 16.4 | | 13.3 | 14.6 |
| IW3 | 24.8 | 29.6 | 24.4 | 25.2 | 19.7 | 18.4 | 24.8 | 19.4 | | 24.5 | | 29.3 | 24.0 | 26.4 |
| IW4 | 38.3 | 40.2 | 38.2 | 41.2 | 44.4 | 29.5 | 39.0 | 0.3 | | 38.3 | 42.9 | 42.9 | 35.9 | 39.5 |
| IW5 | 23.0 | 27.2 | 19.3 | 20.1 | 23.4 | 21.0 | 20.2 | 17.7 | | 20.0 | 23.8 | 22.8 | 21.7 | 23.8 |
| IW6 | 15.3 | 24.8 | 18.5 | | 15.1 | 10.1 | 10.1 | 7.9 | | 12.2 | 19.1 | | 14.8 | 16.3 |
| IW7 | 12.4 | 17.2 | 13.5 | 13.3 | 11.6 | 8.2 | 7.3 | 7.2 | | 8.6 | 12.3 | 14.5 | 11.5 | 12.6 |
| IW8 | 33.0 | 48.5 | 35.6 | 33.9 | 48.3 | 39.6 | 39.9 | 39.8 | | | 37.8 | | 39.6 | 43.6 |
| IW9 | 17.1 | 25.4 | 19.6 | 22.0 | 22.3 | 15.0 | 16.5 | 16.9 | | 15.0 | 22.7 | 20.0 | 19.3 | 21.3 |
| Tube Ref | NO2 / μg/m3 | |||||||||||||||
| Jan | Feb | Mar | Apr | May | Jun | Jul | Aug | Sep | Oct | Nov | Dec | Av. | Bias Corrected Av. | Seasonal+ Bias Corrected. Av | 2010 Forecast Concentration | |
| IW1 | | | 16.2 | | | | | | | | | | | | | |
| IW2 | | | 16.4 | | | | | | | | | | | | | |
| IW3 | | 34.9 | 27.7 | | | | | | | | | | | | | |
| IW4 | 39.3 | 41.6 | 39.6 | | 35.1 | 31.6 | 39.7 | 37.6 | 37.1 | 42.4 | 41.5 | 39.9 | 38.7 | 45.6 | | 39.9 |
| IW5 | 20.9 | 24.3 | 26.0 | | | | | | | | | | | | | |
| IW6 | 15.2 | 20.7 | 20.4 | | | | | | | | | | | | | |
| IW7 | 10.9 | 14.2 | | | | | | | | | | | | | | |
| IW8 | | 45.2 | 41.5 | | | 45.2 | 39.0 | | 35.7 | 36.1 | 40.1 | | 40.4 | 47.7 | 48.2 | 42.2 |
| IW9 | 17.0 | 21.5 | 21.5 | | | | | | | | | | | | | |
Tube IW8 has been seasonally adjusted to tube IW4.
The monitoring results from 2003 and 2004 and 2005 show exceedences at sites IW4 and IW8 in 2003 and 2005 and at IW8 in 2004. The forecast concentrations for 2010 suggest that at IW8 there may still be an exceedence in 2010. The diffusion tubes IW4 and IW8 are situated on lampposts near properties. Therefore concentrations of NO2 at the closest sensitive receptor are lower than the kerbside monitoring sites. Calculation of NO2 dispersion away from the kerb can be calculated by applying the following factors to the NO2 concentration:
| Distance | Dispersion Factor |
| 2 to 5 m | 0.95 |
| 5 to 10 m | 0.90 |
| 10 to 20 m | 0.75 |
IW4 is located 10 metres away from the closest property. Therefore, as a worst case scenario, concentrations of NO2 at the property in 2005 would be
45.6 μg/m3 x 0.90 = 41.0 μg/m3.
This is still an exceedence of the 2005 NO2 objective.
IW8 is located 14 metres away from the closest property. Therefore, concentrations at this property are likely to be:
48.2 μg/m3 x 0.75 = 36.2μg/m3. Therefore, an exceedence of the annual mean NO2 objective is not predicted at the closest property.
IOW 01 Carisbrooke High School NGR SZ 48636 88882
(sited on corner of wall at Science Block)
IOW 02 Cowes High School NGR SZ 49023 96283
(sited on fence at top of basketball court)
IOW 03 92 Horsebridge Hill Newport NGR 49201 91530
(sited on lamp post outside 92 on footpath)
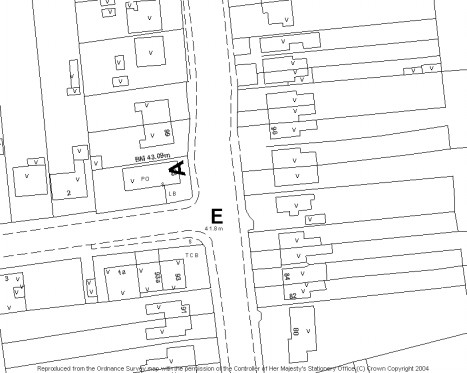
IOW 04 51 Fairlee Road Newport NGR SZ 50378 89557
(sited on sign/lamp post outside 51 on footpath)
IOW 05 153 Fairlee Road Newport NGR SZ 50838 90293
(sited on front of garage at side of house)
IOW 06 Ryde High School NGR SZ 58499 91916
(sited on lamp post at entrance to car park rear of 78 Pellhurst Road)
IOW 07 Sandown High School NGR SZ 58960 84503
(sited on wall at corner of Science Block)
IOW 08 Lake Hill Lake NGR SZ 59112 83738
(sited on sign post opposite 32 Lake Hill)
IOW 09 Blackwater Junction NGR SZ 50690 86373
(sited on 40 mph sign below car park from Farm shop towards the hollow)
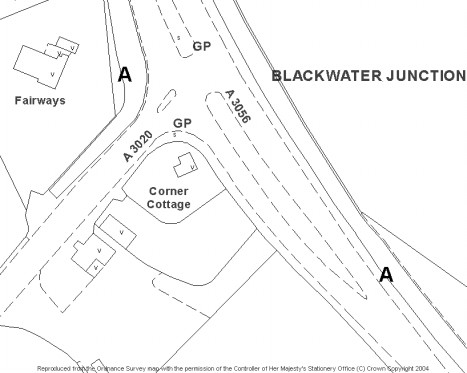
*NGR = National Grid Reference.
A DMRB assessment of nine junctions where the AADT exceeded 10,000, and a receptor is located ten metres from the kerb was carried out where possible, traffic data permitting. The last Updating and Screening assessment stated that no junctions fitting these criteria were met and so the roads used in the previous assessment were not re-assessed.
The input data are presented in Tables 10 and 11, and the results are displayed in Tables 12 and 13. Traffic data were supplied by the Isle of WightCouncil and has been factored using a Total Traffic Central growth factor of 1.69% between 2001 and 2006, and 1.53% between 2006 and 2010. Background concentrations were taken from a 1km by 1km square centred on the grid reference shown (See Table 11). As no HGV data were available, 4 % HGV was assumed throughout as a worst case scenario. A 10 kph traffic speed was assumed for each junction.
| Junction | Road 1 | Road 2 | AADT 2005 | AADT 2010 | Type | Distance to Road Centre 1 | Distance to Road centre 2 | |||
| Road 1 | Road 2 | |||||||||
| 1 | Fairlee Rd | Staplers Rd | 23363 | 7516 | 25245 | 8121 | A | B | 10.3 | 17.5 |
| 2 | Staplers Rd | Cross Lane | 7516 | 8037 | 8121 | 8648 | B | B | 14.9 | 16.1 |
| 3 | Castle Rd | Carisbrooke Rd | 1082 | 14849 | 1169 | 16045 | B | B | 10.5 | 8.2 |
| 4 | Whippingham Rd | Alverstone Rd | 16558 | 694 | 17892 | 750 | A | B | 9.6 | 15.9 |
| 5 | Carpenters Rd | Station Rd | 6805 | 8614 | 7354 | 9309 | B | B | 10.1 | 16.3 |
| 6 | New Road | High Street | 6845 | 6838 | 7396 | 7389 | A | A | 10.3 | 14.7 |
| 7 | Sandown Rd | Newport Rd | 10431 | 18307 | 11272 | 10849 | A | A | 10.3 | 14.7 |
| 8 | High Street | Victoria Av. | 10431 | 6634 | 7389 | 5642 | A | B | 4.4 | 5.1 |
| 9 | Brading Rd | Carpenters Rd | 9540 | 5471 | 10308 | 5912 | A | B | 12 | 14 |
| 10 | Horsebridge Hill | Nodes Rd | 22919 | 5925 | 24766 | 6402 | A | B | 15 | 20 |
| 11 | Newport Rd | St Johns Rd | 7951 | 7461 | 8592 | 8062 | A | B | 14 | 16 |
| 12 | Newport Rd | Niton Rd | 7951 | 2134 | 8592 | 2306 | A | B | 11 | 17 |
| Grid Reference | Junction | 2005 | 2010 | |||||
| NOx | NO2 | PM10 | NOx | NO2 | PM10 | |||
| 450500 | 89500 | 1 | 19.2 | 16.1 | 20.5 | 16.1 | 12.6 | 18.9 |
| 450500 | 89500 | 2 | 19.2 | 16.1 | 20.5 | 16.1 | 12.6 | 18.9 |
| 449500 | 88500 | 3 | 15.8 | 12.3 | 19.5 | 13.0 | 10.2 | 17.9 |
| 451500 | 93500 | 4 | 12.2 | 9.6 | 18.2 | 10.3 | 8.1 | 16.8 |
| 462500 | 88500 | 5 | 11.5 | 9.0 | 18.1 | 9.9 | 7.8 | 16.6 |
| 460500 | 87500 | 6 | 11.6 | 9.1 | 18.2 | 10.0 | 7.8 | 16.7 |
| 458500 | 83500 | 7 | 12.8 | 10.0 | 18.3 | 10.9 | 8.5 | 16.9 |
| 458500 | 81500 | 8 | 11.8 | 9.2 | 18.0 | 10.1 | 7.9 | 16.5 |
| 460500 | 88500 | 9 | 11.6 | 9.1 | 18.1 | 10.0 | 7.8 | 16.7 |
| 448500 | 93500 | 10 | 12.6 | 9.9 | 18.6 | 10.6 | 8.3 | 17.2 |
| 455500 | 81500 | 11 | 10.2 | 8.0 | 17.6 | 8.9 | 6.9 | 16.3 |
| 450500 | 84500 | 12 | 10.4 | 8.1 | 17.9 | 8.6 | 6.8 | 16.5 |
| Receptor number | Name | NO2 * | PM10 | ||
| Road 1 | Road 2 | Annual mean mg/m3 | Annual mean mg/m3 | Days >50mg/m3 | |
| 1 | Fairlee Road | Staplers Road | 29.1 | 29.3 | 25.1 |
| 2 | Staplers Road | Cross Lane | 23.1 | 24.6 | 11.5 |
| 3 | Castle Road | Carisbrooke Road | 20.9 | 24.7 | 11.6 |
| 4 | Whippingham Road | Alverstone Road | 19.8 | 24.5 | 11.2 |
| 5 | Carpenters Road | Station Road | 16.7 | 22.5 | 7.1 |
| 6 | New Road | High Street | 17.6 | 23.2 | 8.5 |
| 7 | Sandown Road | Newport Road | 24.2 | 27.9 | 20.3 |
| 8 | High Street | Victoria Avenue | 20.2 | 24.8 | 11.9 |
| 9 | Brading Road, Rowborough | Carpenters Road | 17.7 | 23.1 | 8.4 |
| 10 | Horsebridge Hill, Newport | Nodes Road | 21.5 | 26.0 | 14.9 |
| 11 | Newport Road, Godshill | Saint Johns Road | 16.2 | 22.3 | 6.9 |
| 12 | Newport Road, Godshill | Niton Road | 14.6 | 21.5 | 5.4 |
| Receptor number | Name | NO2 * | PM10 | ||
| Road 1 | Road 2 | Annual mean mg/m3 | Annual mean mg/m3 | Days >50mg/m3 | |
| 1 | Fairlee Road | Staplers Road | 22.4 | 24.0 | 10.2 |
| 2 | Staplers Road | Cross Lane | 18.0 | 21.5 | 5.4 |
| 3 | Castle Road | Carisbrooke Road | 16.7 | 21.0 | 4.7 |
| 4 | Whippingham Road | Alverstone Road | 15.6 | 20.4 | 3.9 |
| 5 | Carpenters Road | Station Road | 13.7 | 19.3 | 2.6 |
| 6 | New Road | High Street | 14.3 | 19.7 | 3.0 |
| 7 | Sandown Road | Newport Road | 17.5 | 21.4 | 5.3 |
| 8 | High Street | Victoria Avenue | 14.2 | 19.4 | 2.7 |
| 9 | Brading Road, Rowborough | Carpenters Road | 14.4 | 19.7 | 3.1 |
| 10 | Horsebridge Hill, Newport | Nodes Road | 17.0 | 21.5 | 5.5 |
| 11 | Newport Road, Godshill | Saint Johns Road | 13.2 | 19.2 | 2.5 |
| 12 | Newport Road, Godshill | Niton Road | 11.7 | 18.6 | 1.9 |
Prepared by: Approved by:
Emily Nicholl Gareth Collins
Environmental Scientist Principal Environmental Scientist
Updating and Screening Assessment 2006
Environmental Scientist Principal Environmental Scientist
Updating and Screening Assessment 2006
| Rev No | Comments | Date |
| | | |
| 1 | | |
Enterprise House, 160 Croydon Road, Beckenham, Kent, BR3 4DE
Telephone: 0870 905 0906 Fax: 020 8663 6723 Website: http://www.fabermaunsell.com
Job No 47694IBEE Reference EN Date Created April 2006
This contains confidential and commercially sensitive information, which shall not be disclosed to third parties.
f:\projects\47694ibee - usas 2006\iow\usa2006\draft usa report.doc
Page last updated on: 18/12/2009